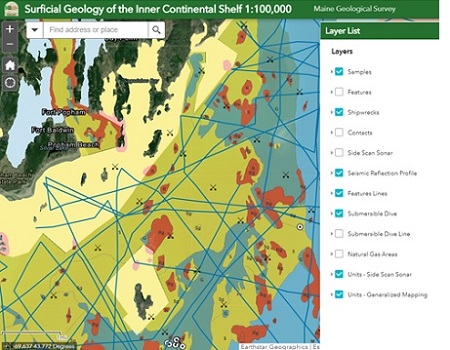
The Maine Geological Survey Inner Continental Shelf Web Viewer shows interpreted seafloor sediment for state waters and the locations of previous sampling efforts: https://www.maine.gov/dacf/mgs/pubs/digital/ics.htm
Introduction
Whether managing beaches, modeling fisheries habitat, or planning for shared uses in the marine environment, scientists and managers rely on information about the seafloor's sediment as a fundamental part of research and decision making. Through the Maine Coastal Mapping Initiative (MCMI), we have consolidated information from past studies and gathered new data to support research and management in state waters and the Gulf of Maine.
In the 1980s and 1990s, the Maine Geological Survey (MGS) in collaboration with the University of Maine used side-scan sonar and sub-bottom profiling to map small portions of the seafloor and collected sediment and core samples to ground truth those readings. These data were used to improve bathymetric maps and to model the composition of the seafloor along the entire coast of Maine. These 1:100,000 scale maps are available from the MGS Intercontinental Shelf Data Platform, as well as an interactive map showing the locations of the collection of side-scan sonar, sub-bottom profiling, and surficial grab samples.
Since 2014, MCMI has used a multibeam echosounder to collect hydrographic quality bathymetry to further improve maps of the region, as well as provide seamless information about the hardness of the seafloor (a proxy for seafloor sediment). These efforts have led to better understanding about the movement of beach nourishment sands, the location and amount of offshore sand resources, and can help inform fisheries habitat modeling and the siting of marine activities.
Technical Reports
Links to the reports, with the citation and summaries, are below. PDF files may require free Adobe Acrobat Reader software (download here) to view or print.
Assessing Sediment Budgets in Support of Beach Nourishment and Coastal Community Resiliency: Topographic and Bathymetric Beach Change Analyses for Wells, Saco, and Scarborough Study Areas (PDF file, 23 pages, 3.3 MB)
Technical Report
Peter Slovinsky, Maine Geological Survey, December 2020
Summary: The Maine Geological Survey, Maine Coastal Program, and Nearview LLC completed topographic and volumetric change detection analyses at three Maine beaches following onshore or nearshore beach sand replenishment using the combined data from unmanned aerial surveys, single-beam echosounder, and multi-beam echosounder. This report analyzes the change at each beach from the topographic high tide extent to the theoretical depth of closure.
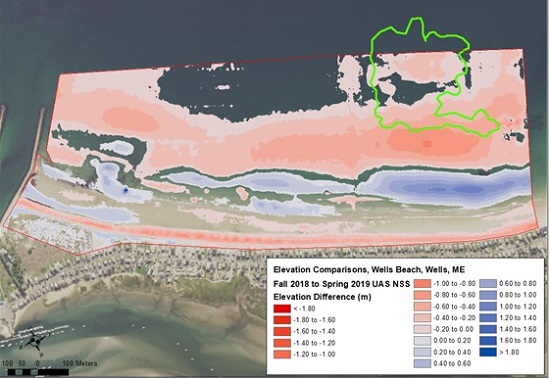
Example of Wells Beach volume changes within the NSS and UAS AOIs from fall 2018 to spring 2019 using GCD tool. The green outline was the nearshore placement site for sand dredged from Wells Harbor in June 2018 (from Slovinsky 2020, Technical Report).
Bathymetric Change and Sand Dynamics in the Kennebec River and Offshore Popham Beach (PDF file, 58 pages, 15.2 MB)
Technical Report
Stephen M. Dickson, Maine Geological Survey, and Benjamin Kraun, Maine Coastal Program, December 2020
Summary: This work focused on the Kennebec River sand budget to better understand its role in the creation and preservation of beaches. Multibeam surveys of the Kennebec River collected backscatter and bathymetry in 2017 and 2019. Three sections or reaches of the river were analyzed for change detection to quantify a 2-year sediment budget. Around 85% of the area studied underwent riverbed elevations change in excess of 10 centimeters vertically. The analysis indicated a net gain of 1.3 million (+/- 0.5 million) cubic meters of sand over two years from the study area. There are no large sedimentary depositional environments within the Kennebec River channel that can accommodate such a large volume of sediment. Therefore, volume loss most likely represents beach sand export to the ocean.
Seafloor Sediment Textural Mapping of the Inner Continental Shelf: Cape Small to Cape Newagen, Maine (PDF file, 55 pages, 13.1 MB)
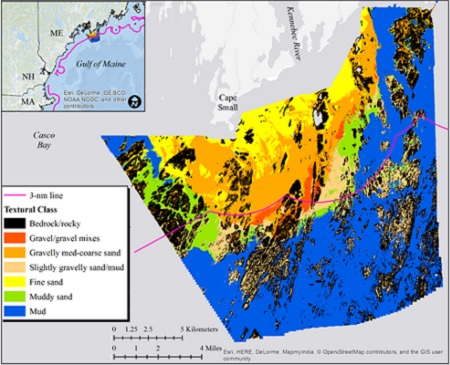
Raster output for 7-class seafloor textural classifications, Cape Small to Newagen. Credit: MCMI.
Technical Report
Kerby Dobbs, Maine Coastal Program
April 2017
Summary: Seafloor sediment textural maps were generated using a supervised classification technique based on bathymetry and backscatter data, 1st-order bathymetric derivatives, and grab sample data as inputs. The accuracy of textural output maps was evaluated using sediment samples and bottom videos. The accuracy of model output and its ability to produce areal distribution of sediment types and corresponding depths consistent with general interpretations of seafloor sediment distribution and morphology in the coverage area suggest this is an efficient and effective method for mapping seafloor substrate. Two models identified areas of fine sand with an 80% accuracy. Overall, the products of this investigation are most useful for visualizing spatial trends in sediment and benthic habitat distribution and identifying and/or refining knowledge of resource (abiotic and biotic) potential.
Preliminary Sand and Gravel Reservoirs Assessment for Federal Waters: Mid-coast Maine (PDF file, 26 pages, 5.4 MB)
Technical Report
Kerby Dobbs, Maine Coastal Program
February 2017
Summary: Following Hurricane Sandy, the Bureau of Ocean Energy Management recognized the need to identify additional outer continental shelf sand resources for beach nourishment and coastal restoration projects because sand resources in state waters are either diminishing or are of poor quality, or otherwise unavailable. In this investigation, the MCMI combined new and pre-existing geological and geophysical data to characterize and estimate volume for potential sediment resources in waters of federal jurisdiction within Maine's mid-coast region.
Results identified 6 distinct zones containing potential sand and gravel resources within federal waters, with a combined total volume of approximately 32 million cubic meters (42 million cubic yards). Overall, this investigation highlights the need for more comprehensive assessment and management of additional potential resources (e.g. shoreface/nearshore deposits) for beach nourishment and coastal restoration efforts within the region.
2017 Seafloor Sediment Sampling: Southport Island to Monhegan Island, Gulf of Maine (PDF file, 96 pages, 8.0 MB)
Technical Report
Kerby Dobbs, Maine Coastal Program
November 2017
Summary: The purpose of this investigation was to collect seafloor substrate data within the 2017 focus area and combined with existing data will help accomplish the following objectives: benthic habitat classification, modeling and mapping via the federally-approved Coastal and Marine Ecological Classification Standard, generation of generalized seafloor sediment maps, build upon existing knowledge of local and regional geologic framework, and assess potential sand and gravel reservoirs. This report presents summarized bottom sample (69 sites) data collected by the MCMI during the 2017 field season (April to September), generalized descriptions of sand and gravel deposits, and preliminary sediment mapping of the approximately 125 mi2 (325 km2) survey area offshore of midcoast Maine between Southport Island and Monhegan Island.
2016 Seafloor Sediment Analysis and Mapping: Mid-coast Maine (PDF file, 119 pages, 27.8 MB)
Technical Report
Kerby Dobbs, Maine Coastal Program
February 2017
Summary: The purpose of this investigation was to collect additional seafloor substrate data within the 2015/2016 focus area, which when combined with existing data has helped accomplish the following objectives: perform benthic habitat classification, modeling and mapping via the federally-approved Coastal and Marine Ecological Classification Standard, generate seafloor sediment maps using advanced GIS techniques, and conduct volumetric assessment of potential sand and gravel reservoirs within federal waters. The data presented in this report represent the seafloor sampling efforts and sediment analyses conducted by the MCMI during the 2016 field season (April to October), which included bathymetric mapping for approximately 57 mi2 (148 km2) of seafloor and the collection of bottom samples in 54 locations, 43 in state water and 11 in federal waters, in the vicinity of the Kennebec River paleodelta.
2015 Seafloor Sediment Analysis and Mapping: Midcoast Maine (PDF file, 133 pages, 18.9 MB)
Technical Report
Kerby Dobbs, Maine Coastal Program
January 2016
Summary: The collection and analysis of geophysical and seafloor sediment data allow state and federal agencies to proactively identify the resources available to enhance resiliency, improve management of resources within their jurisdiction, and develop a more comprehensive understanding of potential resources. During the 2015 survey season MCMI mapped approximately 80 mi2 (207 km2) of seafloor and collected bottom samples in 61 locations, 43 in state water and 18 in federal waters, in the vicinity of the Kennebec River paleodelta. Grain-size analyses of sediment samples combined with interpretations of backscatter intensity and bathymetric data are consistent with general interpretations of seafloor sediment distribution and morphology in the region. Within the survey area, laterally extensive surficial deposits of predominantly sandy and/or gravelly material were restricted to depths less than 70 m and were most commonly associated with the Kennebec river paleodelta/nearshore ramp. Similarly, backscatter and grab sample data suggest these deposits were even more scarce within federal waters of the survey area.
2014 Seafloor Sediment Analysis and Mapping: Southern Maine (PDF file, 157 pages, 22.3 MB)
Technical Report
Kerby Dobbs, Maine Coastal Program
January 2016
Summary: In 2014, the Maine Coastal Mapping Initiative collected 28 sediment samples in the federal portion of the focus area located offshore of Kennebunkport in Southern Maine, though 49 additional samples were collected nearer to shore. Samples were processed to determine the relative concentrations of gravel, sand, and mud (Folk 1954), and the sand fraction was further analyzed to determine the degree of sorting and the distribution of grain sizes within the fraction (Wentworth 1922). Additionally, sediment color (Munsell, 1923) was also determined to further explore the potential compatibility of nourishing existing beaches with sediment dredged from offshore deposits. Although sand was more abundant closer to shore, 16 out of the 28 samples collected in federal waters contained >50% sand (mean sand composition of all samples = 46.3% Ò 22.4%).