Home → Water Quality → Monitoring → Invasives → Lake Vulnerability Index
Understanding the Vulnerability of Maine Lakes to Invasive Aquatic Plants
Maine Lake Vulnerability to Invasive Aquatic Plants:
A Lake Vulnerability Analysis and a Predictive Model
Purpose for the vulnerability analysis and model.
While some Maine lakes are grappling with invasive aquatic plant infestations, the vast majority of lakes remain free from these non-native plants. Analyzing a lake’s risk of colonization by invasive aquatic plants allows the Maine DEP and its partners to most effectively use limited resources to protect lakes and target those needing additional evaluation.
The vulnerability analysis and model are separate tools to assess lake vulnerability to invasive aquatic plant infestation. They are based on available data, assumptions and statistical analyses and therefore may or may not reflect reality. A low risk score for infestation doesn’t confer invulnerability and a high score does not mean a lake will inevitably become infested. In reality, some lakes with low risk scores are infested while others with high risk scores are not infested. Before we delve into the details of these tools, please remember: every lake is at risk.
The Vulnerability Analysis
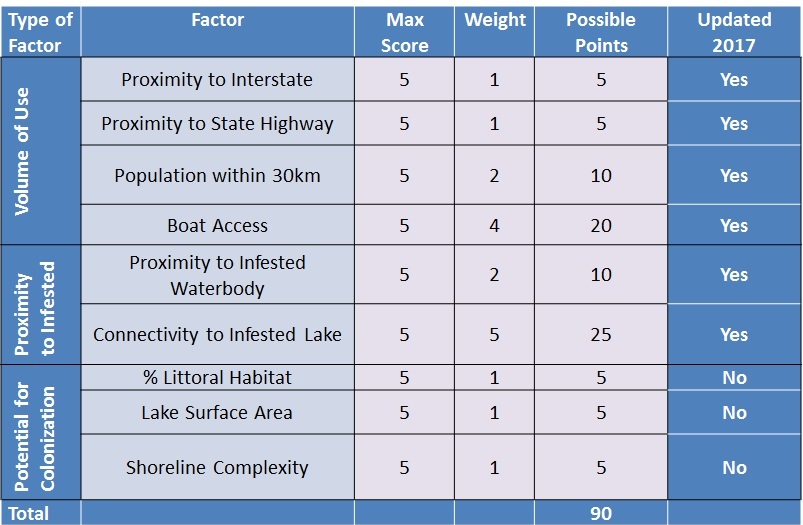
The first iteration of the Lake Vulnerability Analysis to invasive aquatic plants was developed in 2004 by the Maine Department of Environmental Protection (DEP) and the Maine Natural Areas Program (within the Department of Agriculture, Conservation and Forestry). The purpose of this analysis is to assess the risk of Maine lakes to infestation by invasive aquatic plants. Geographic Information System (GIS) analysis was used to assign each lake a risk score using nine parameters grouped into three categories.
In 2017 the DEP revised the Vulnerability Analysis with current data and evaluated the statistical significance of each parameter used in the scoring. Data were placed into one of three categories that are described below. In total, DEP analyzed 2,664 data from Maine lakes of 10 acres or larger.
How were Vulnerability Scores developed?
After updating with available data, a GIS analysis assigned each lake a vulnerability score using nine parameters grouped into the three categories below.
Category 1: Volume of Use.
Parameters in this category are 1) proximity to interstate and state highways, 2) total population within 30 km (18 miles) of the lake, and 3) presence and type of boat access. Lakes that are close to highways, are in areas of high population density, and have trailerable boat launching sites are expected to have a greater risk of infestation.
Category 2: Proximity to Infested Waterbody.
This category was created by analyzing 1) distance to the nearest infested waterbody, 2) whether the lake was hydrologically connected to an infested waterbody and, if so, 3) whether the lake is upstream or downstream of the infested waterbody. It’s reasonable to assume that a lake downstream of a nearby infestation is more likely to be colonized by the dispersal of plant material than one upstream of an infestation.
The number of known infestations used for the “proximity to infested waterbody” category increased between 2004 and 2017. In 2004 the proximity analysis included 24 infested waterbodies including rivers and lakes. In 2017 there were 57 active or eradicated infestations in Maine and 10 in New Hampshire within shared watersheds. This resulted in higher proximity to infested waterbody scores for many lakes.
Category 3: Potential for Colonization.
This category includes several physical characteristics of each lake including 1) total surface area, 2) the percent of the lake considered littoral habitat, and 3) the complexity of the shoreline. Littoral habitat is meant to represent the area of a lake with sufficient light for plant growth reaching the lake bottom. The shoreline complexity parameter indicates the sinuosity of a lake’s shoreline A sinuous shoreline with many coves will provide more plant habitat for aquatic plants in general, and may increase potential for invasive plant colonization.
Each of the nine parameters received a score from 0 to 5. However, it’s likely that not all parameters have equal impact on risk of infestation. Using best professional judgement, we developed a weighting system to indicate the relative risk of each parameter. The initial score for each parameter is multiplied by a given weight indicating the parameter’s influence on whether a lake may become infested. For example, most research shows that people using the lake are the major vector spreading invasive aquatic plants, so a trailerable boat launching site is weighted as 5. Lake surface area, however, may have less influence on infestation risk, so it is given a weighted score of 1.
To calculate the risk score for each lake, we summed the weighted scores for each of the nine parameters. The highest possible score is 90.
Summary of Vulnerability Scores
Using the total risk scores, Lakes were grouped as low, medium or high risk of infestation. DEP used a histogram and best professional judgment to determine group breaks. Lakes with scores below 30 are at low risk of infestation. Lakes with scores 31-49 are considered moderate risk, and lakes scoring 50-87 are high risk.
In the 2017 evaluation, individual lake scores ranged from 11-87 (maximum possible score is 90) with a mean score of 26. Lakes known to have infestations scored higher overall with scores ranging from 30-87 and averaging 70.3. Non-infested lakes had a lower average score of 25.5. The number of uninfested lakes that scored in the moderate (>50) and high risk (>70) categories increased from 122 in 2004 to 147 in 2017. These increases indicate an overall increasing risk of infestation.
Scores for 191 lakes decreased, likely because of slight changes in nearby population density. Scores for 478 lakes increased, mainly due to increase in the number of infested lakes in 2017 (57) vs in 2004 (24), resulting in higher scores for lakes that are connected or near the infested lakes. Of the lakes with increased scores, 50 went from low risk to moderate risk and 43 moved into the high-risk category.
In 2019, Canadian lake infestation data were added to the Vulnerability Analysis. This resulted in revised risk scores for the St John River Region. Overall, 923 lake scores changed with the addition of Canadian data: 117 lakes in the Coastal Region, 439 lakes in the Interior Region, and 367 lakes in the St John River Region. Of these lakes, 24 moved from moderate or low risk to high risk (score >49), 302 moved from low risk (score <30) to moderate risk (score 30-49). Proximity and connectivity to infested waterbodies are the two factors that influenced the increase. On average, scores for lakes affected by the Canadian data increased by 8 points. The greatest increase in scores was in lakes from the Coastal and St John River regions.
In the St John River Region, the mean increase was 15 points, with the highest single lake score increase being 21. Twenty-two lakes moved from moderate risk (30-49) to high risk (>49). In the Coastal Region, the mean increase in score was 2. However, 9 lake scores increased greater than 19, the highest being 33. Two lake scores moved to high risk while 4 lakes moved to the moderate risk category.
A Model to Predict if a Lake is Infested
In addition to updating the Vulnerability Analysis, DEP has developed a statistical model to predict if a lake is infested with an invasive aquatic plant. The model provides an additional tool to assess a lake’s risk to invasive aquatic plants. Better yet, coupling the model predictions along with the Vulnerability Analysis helps DEP focus on at-risk lakes.
The model was created using a statistical method called logistic regression. Logistic regression calculates the probability of a response; In this case, a “response” is that a lake is infested. The analysis produces a “receiver operating characteristic” (ROC) curve, which relates to the likelihood of the model to predict a response correctly. In a perfect model, the area under the curve (AUC) would be 1.0.
Data were analyzed for the model in two steps. First, because just 1% of Maine lakes are infested, lakes in the analysis were grouped using a Maine lake classification developed by Jeremy Deeds, a DEP lakes biologist. This classification groups Maine lakes into three distinct lake regions in Maine according to drainage basin and lake morphology. The most northern region in Maine, the St John’s River region, has no known invasive aquatic plants. In absence of Canadian data on aquatic plant infestations, this region was not used in the 2017 analysis. However Canadian data was obtained in 2019, and we plan to update the model with these data in the future.
Maine’s infestation data therefore fell into the two remaining regions: Coastal and Interior. Each region was individually analyzed before being combined into a single model for the State of Maine. This statewide model was analyzed using information from the smaller regional models. To test the accuracy of the model, data were evenly divided and run through the model to see if it could predict what was already known about a lake’s infestation status.
Model Results and Discussion
The best fit model created for our data included four of the nine parameters. These parameters are 1) Connection to an Infested Waterbody, 2) Proximity to an Infested Waterbody, 2) Population greater than 50,000, and 4) Boat Access. The final Model had an AUC of 0.932, meaning it is an excellent model. To test the model, we split the data into equal parts. Key model results include the following:
- The model accurately predicted 30 of the 35 (85%) known infested lakes.
- The model predicted a total of 81 lakes to be infested, of which 51 are NOT infested. All but 10 of those have a Courtesy Boat Inspection (CBI) program or have had a partial plant survey. It is a high priority of the DEP’s Invasive Aquatic Species Program to survey those lakes that have not been surveyed.
Comparing model results of lakes predicted to be infested with lake Vulnerability scores provides a further check of the model’s validity. One would expect that a lake predicted by the model to be infested would have a relatively high vulnerability score, and this was generally true. Of the 81 lakes predicted by the model to be infested, 48 were high risk, 25 were moderate risk, and on 8 were low risk according to the Vulnerability Analysis.
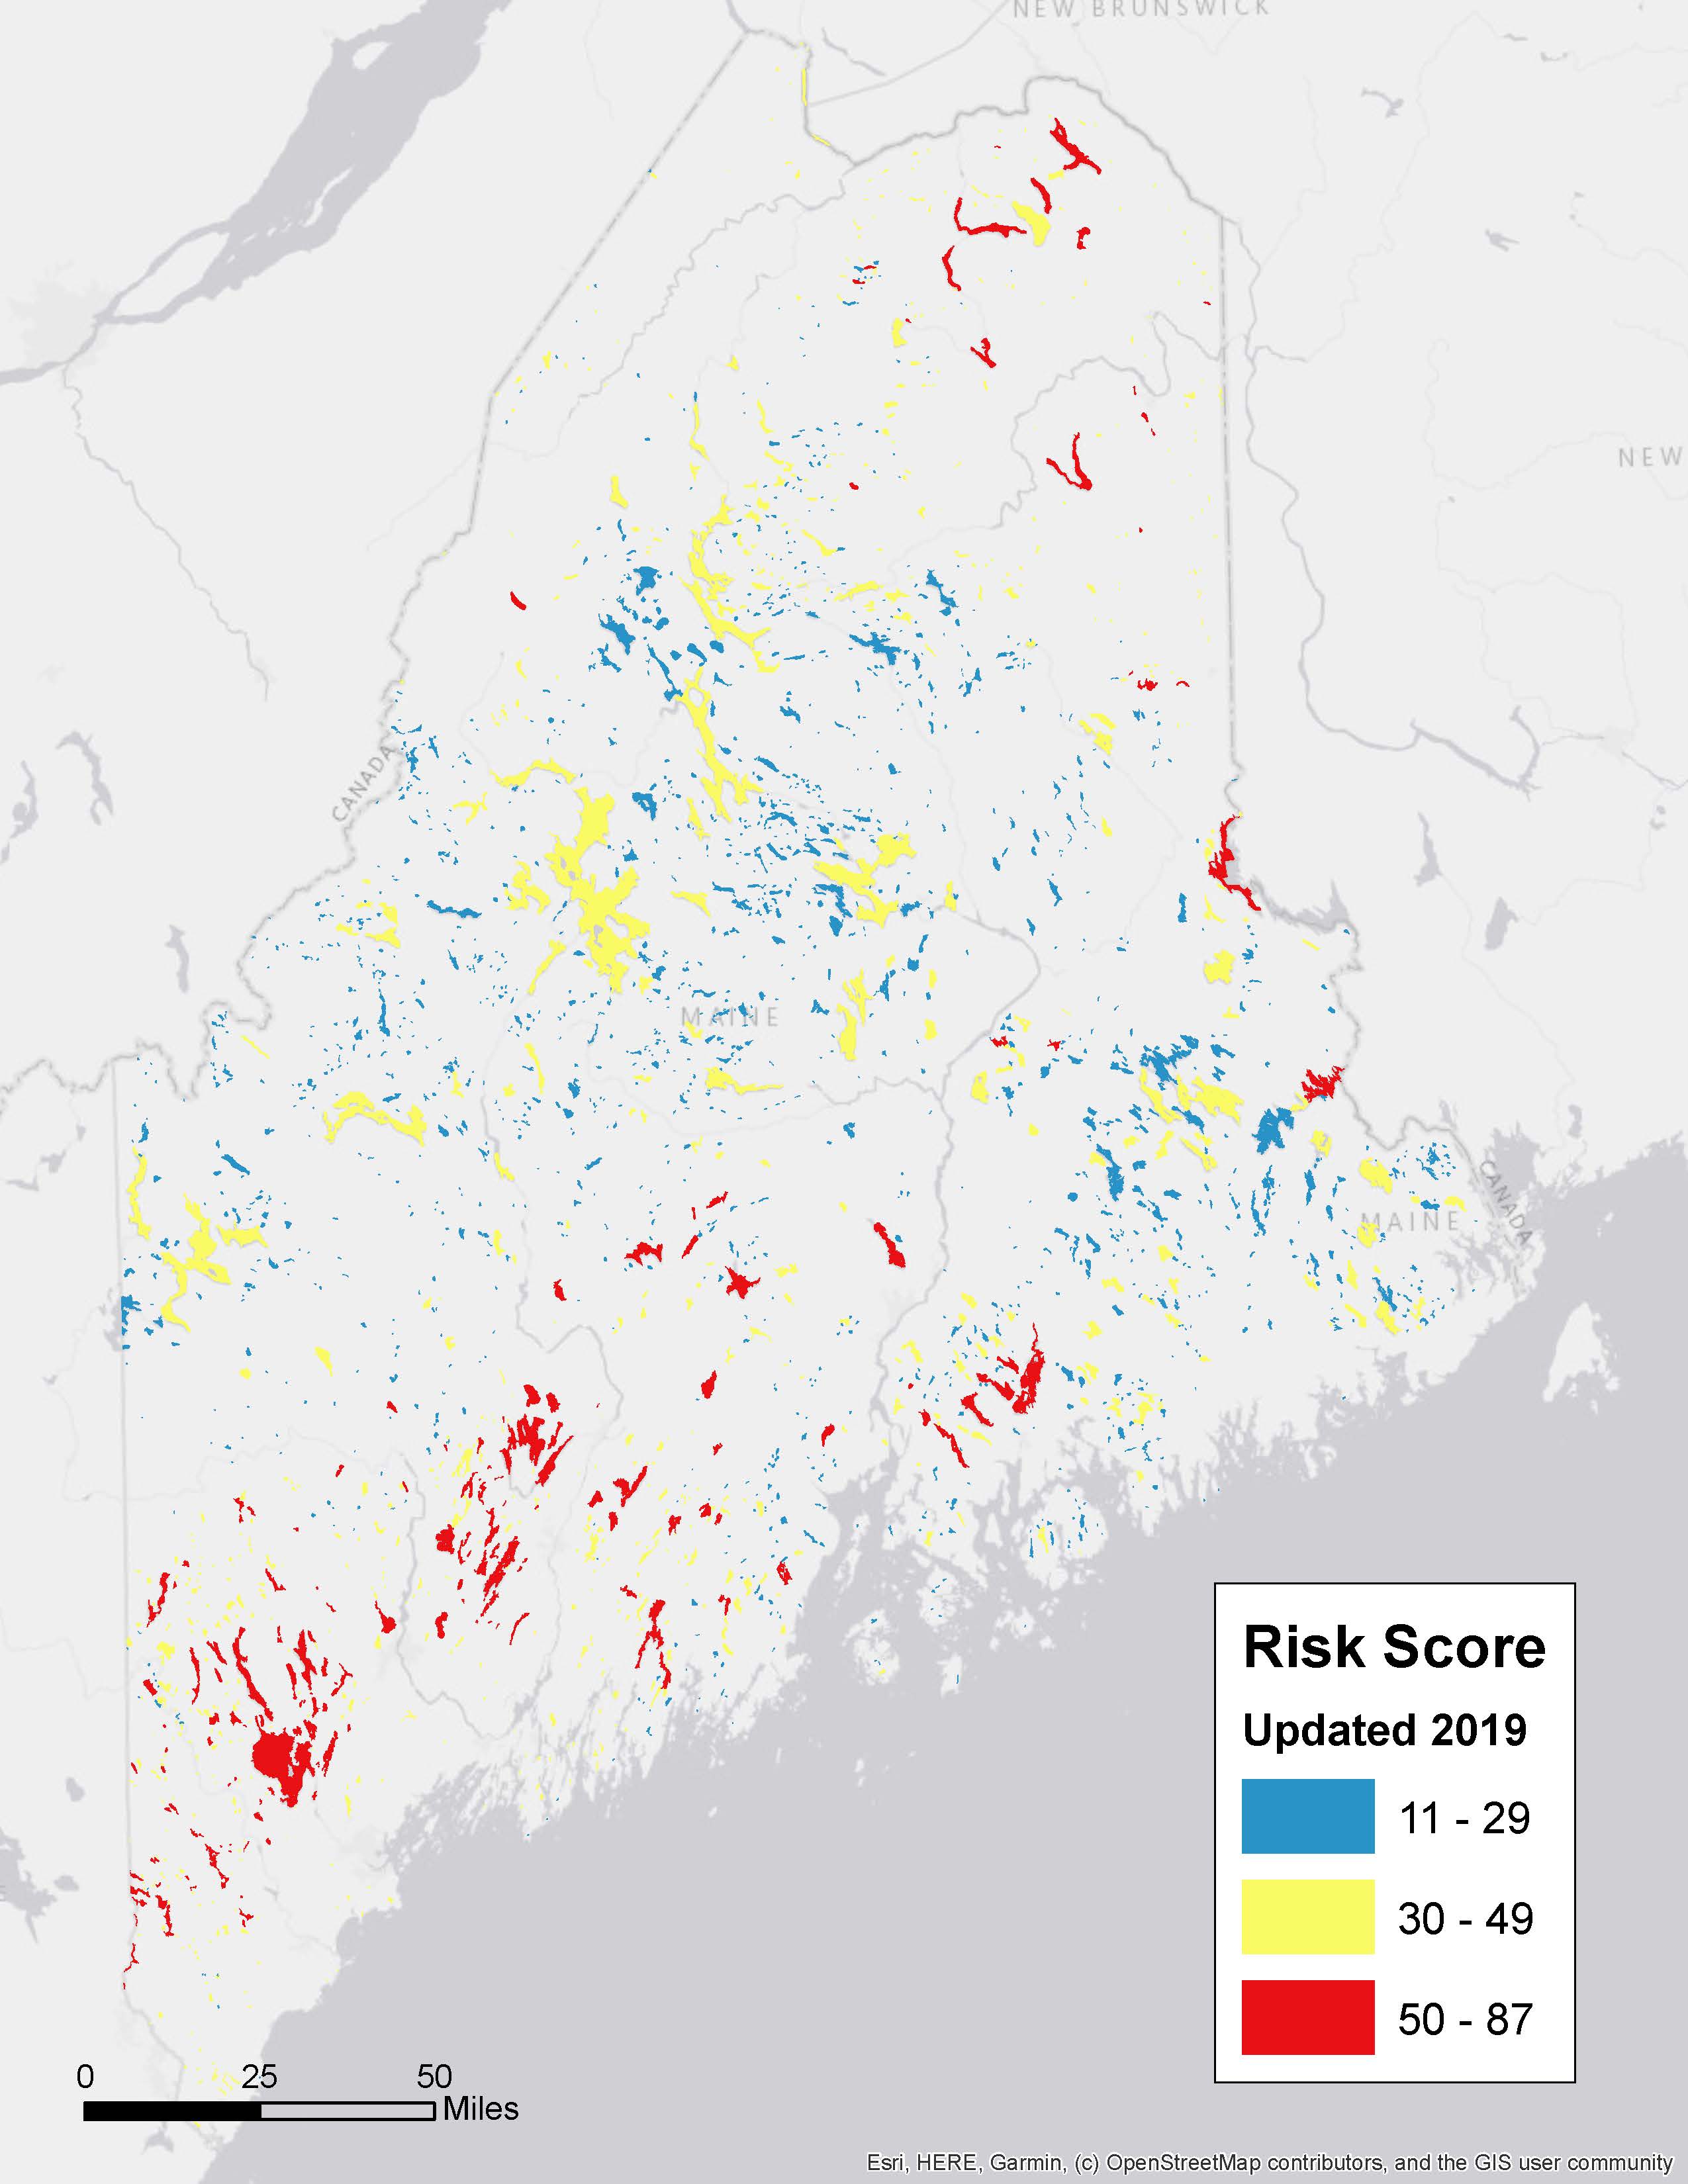
2019 Lake Score Map
What did we learn?
Maine is fortunate in that only 1% of our lakes have invasive aquatic plants. However, every waterbody in Maine is at some risk of becoming infested with an invasive aquatic plant. We know of at least one infested Maine lake that has a low Vulnerability score and is not predicted by the model as infested; it can happen! Considering the limitations of the data used in the analysis, the vulnerability scores and model results can still be used to assess the level of risk and predict whether a lake will become infested with an invasive aquatic plant.
Revising the 2004 Vulnerability Analysis and developing the probability model helps DEP and local cooperators target the expansion of prevention and early detection efforts to slow the spread of invasive aquatic plants, and potentially other aquatic invasive organisms, to Maine lakes and rivers. Both tools will continue to evolve as we discover new data related to the biology of invasive aquatic plants.
We are considering additional data for the Vulnerability Analysis and the model that may provide further insight into lake risk to invasive aquatic plants. For example, we are currently evaluating if the origin of transient boaters or fish species in a lake may contribute to lake risk. With many unknowns remaining, at least one thing is certain: prevention and early detection offer the best success against aquatic invaders and avoid the high costs of managing an infestation.
You will find the data for your lake at the Lake Risk Score Data and Map.
If you are interested in initiating a plant survey please contact the Lake Stewards of Maine. If you are interested in starting a CBI program on your lake send an email to milfoil@maine.gov