Home → Air Quality → Air Quality Forecast → Forecast, Ozone and Particle Pollution → FAQs
Maine's Air Quality Forecast, Ozone and Particle Pollution
Frequently Asked Questions
- Why does MEDEP issue air quality forecasts year-round?
Maine DEP Air Quality Meteorologists issue Air Quality Forecasts every day of the year because air quality is not just seasonal. Ozone is a photochemical pollutant which means it requires strong sunlight. That is why ozone levels are only a problem in Maine during the warmer months when the days are longer and the sun is higher in the sky. However, particle pollution levels can climb at any time of the year in Maine. During the summer months particle pollution levels can rise due to regional events. During the winter particle pollution levels can climb due to a combination of factors including winter heating needs. For more information forecast availability, ozone and particle pollution visit {Maine's Air Quality Forecast, Ozone and Particle Pollution webpage](https://www.maine.gov/dep/air/aqforecast/forecast-info.html)
While the Air Quality Forecast is submitted to EPA's AirNow web site and there are unaffiliated apps available, Maine DEP's Air Quality Forecast web site is the best place to check the forecast because, when it is appropriate, this page includes more information than is available on AirNow or on any apps available. This can include more information about timing of the pollution or what is contributing to higher levels.
- Why was Maine broken into the eight Air Quality Forecasting regions?
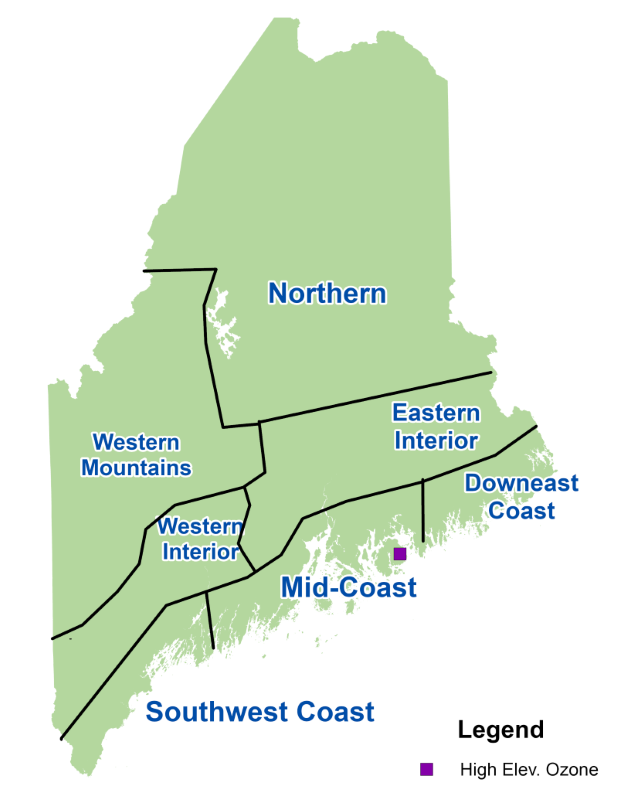
Forecast map For years we had three forecast regions: Coastal, Interior and Northern. As we learned more about how ozone and particle pollution behaved in Maine it became apparent that the three regions were not adequate. They were fairly good for ozone, but not good at all for particle pollution. So we refined and subdivided the former regions using the monitoring data for both pollutants and our best judgement. We created seven major forecast regions which display in the table as well as on the forecast maps. This gives us more flexibility in issuing a graphical forecast and better descriptive and consistent regional terms to use in the text and hotline messages.
Of course, it also pushes us to do better and refine our forecasting knowledge.
In addition to the seven major forecast regions, we've added a region called 'High Elevation'. This region includes the ozone monitor on Cadillac Mountain in Acadia National Park. The High Elevation forecast region only displays in the table because it would have been a tiny dot on the map which would have been hard to display properly.
- Can you describe each of the forecasting region's coverage area?
What follows is a general description of each of the forecasting regions.
Northern - All of Piscataquis & Aroostook Counties, the northern 1/3 of Somerset, the northern half of Penobscot County and the northern half of Washington County.
Western Mountains - Includes all of Oxford & Franklin counties and the southern 2/3 of Somerset County.
Western Interior - Inland York, Cumberland, Sagadahoc and Lincoln Counties, and all of Androscoggin & Kennebec Counties.
Eastern Interior - Inland Knox, Waldo & Hancock Counties, the southern half of Penobscot and the middle portion of Washington County.
Southwest Coast - Narrow band of 1 to 2 towns wide along the coast from Kittery through Reid State Park.
Mid-Coast - Band of coastal towns 2-3 wide from Southport through Gouldsboro.
Downeast Coast - Band of coastal towns 4 wide from Steuben through Eastport.
High Elevations of Acadia National Park - Cadillac Mountain
- I live on the border between two (or more) forecast regions. When they have different forecasts, which should I follow?
In the atmosphere manmade boundaries do not exist and neither do forecast regional boundaries. The forecast regional boundaries were positioned based on years of monitoring information and our best judgement. It is a good idea to view the borders as a transition between regions rather than a sharp difference. If you are sensitive to the pollutant in question and live or expect to be along the border between two differing forecasts assume the higher/worst forecast category from the regions will prevail in your area. This will enable you to take appropriate precautions to safeguard your health. We strive to give you the information you need to protect your health. While the forecasting regions allow us to issue a forecast that more accurately portrays what we believe will happen, there are more border areas than before.
- Can I be alerted when Air Quality is forecast to be poor?
Yes, you can. EnviroFlash and EPA's mobile AirNow app all alert folks to poor air quality.
EPA created EnviroFlash an automated zip-code based air quality alert email notification system. EnviroFlash covers the entire state of Maine and allows the subscriber to decide at which Air Quality Index (AQI) level to receive email notification.
DEP's Air Quality Meteorologists submit the forecast to EPA's AIRNOW system every day of the year. EnviroFlash will review the forecast in AIRNOW at 4:00 each afternoon and when tomorrow's forecast in your location matches the criteria you set up an email will be sent to you. Let EnviroFlash help you 'Keep an eye on the AQI'.
Go to: http://www.maine.gov/dep/air/ozone/enviroflash.html for more information about EnviroFlash and how to subscribe then click on the map to initialize the subscription process for EnviroFlash! EnviroFlash also allows you to manage your subscription. It is important to note if you choose to receive texts on your cell phone you need use that 'email-like' address to look up your subscription.
AirNows mobile app -- EPAs AirNow app has a sleek new look and improved functionality! Download the updated app for free on the Apple App Store or the Google Play Store.
- The Air Quality Forecast for a pollutant is different than what the current data shows. Why is that?
You are viewing the data during a small part of the day, yet values may be different during another part of the day. The forecast is based on what we believe will be the worst in that region for the day.
This is often the case with ozone which is a photochemical pollutant and peaks during the afternoon hours (from April through September). Both morning and evening values are likely to be low. Ozone forecasts are for the highest 8-hour period of the day.
For Particle Pollution values, the running 24-hour average for several hours may be Moderate yet the block 24-hour average from midnight to midnight for that day ends up being Good. The latter is the EPA standard. If we believe that a running 24-hour average will be moderate yet most of it will be during the overnight hours we will forecast Good for both days but note in the comments that higher levels are expected during the night. This happens when particle levels will build in late one day and clear out early the next. If we believe that levels will be higher during the morning and evening hours of the same day then that day will be forecast as Moderate.
The Air Quality Trends pages have hourly and other trends for ozone and particle pollution.
Finally, although we make every effort to forecast as accurately as possible, it is still an inexact science and, just like the weather forecasts upon which we base our Air Quality Forecasts, we may be wrong. Sometimes we know the values will end up near the break point between categories. In those cases, we carefully weigh the various factors contributing to the pollution levels and decide based on experience and the most likely weather conditions expected. Sometimes we believe it will be such a close call that we err on the side of protecting the public and issue the forecast for the higher of the two categories. Unlike weather forecasters, who are able to give a range of temperatures or weather conditions, we issue forecasts for a specific category with set breakpoints. Thus a very small change in pollution levels will 'make' or 'break' the forecast.
- In a recent forecast discussion you mentioned a 'dirty air mass'. What do you mean and what causes an air mass to be dirty?
A dirty air mass is caused by a slow-moving High-pressure system trapping and pushing air pollution across the country. There is no specific source or region contributing to the pollution. All emissions from highly populated areas, industrial sources, mobile sources, smoke from wild fires and more get trapped in the air mass. The slower it moves across the country the dirtier it is by the time it reaches New England. The only relief for Maine comes when a front finally pushes that air out to sea. The strength, direction of movement and speed of a front determines which areas of Maine will clean out first. A strong and/or fast-moving front will clean Maine out quickly while a slow moving and/or weak front will take longer to clean out the state.
- I can see pollution in the air, is it ozone?
Ozone is often described as a colorless pollutant. In fact, it is a pale blue. So for all intents and purposes you cannot see ozone. You may be looking at fog or mist. If you are seeing pollution in the air, it is likely particles. Particle pollution affects the lungs and so much more. Check out the health messages by going to: https://www.maine.gov/dep/air/ozone/aqiandhealth.html