Home → Air Quality → Meteorology Home > Permit Air Quality Modeling Guidelines > Modeling Protocols and Submittals
Modeling Protocols and Submittals
As found in MEDEP-BAQ Air Regulations, Chapter 115 (Word) Subsection 7(E) and Chapter 140 (Word) Subsection 14(E), it is required that the applicant develop a written modeling protocol to clearly document and submit the necessary information to MEDEP-BAQ prior to performing an air quality dispersion modeling analysis.
This written protocol should be consistent with all applicable regulations and minimally contain information listed in this section. The modeling protocol shall include on compact disc (or other media) ALL input, output and diagnostic files (modeling files, BPIP/GEP analysis files, receptor/terrain/DEM grids, meteorological data (including all raw and diagnostic data files), etc) for MEDEP-BAQ review.
Model Selection
There are many factors to consider when selecting the appropriate model for use. These factors include, but are not limited to: type of release, downwash/cavity issues, location of ambient air, complex wind flows (stagnation, land-sea interface, valley channeling, etc), availability of meteorological data, etc.
All modeling shall be performed using the most current version of the model (please include the version number). MEDEP-BAQ should be consulted to discuss and verify the model most appropriate for demonstrating compliance. Modeling completed using obsolete versions of models (and any pre-processors) will be immediately rejected!
Source Information
The source being modeled should be described. Identify and detail all combustion and process equipment to be included in the modeling analysis not otherwise exempted from air emission licensing requirements (as set forth in Chapters 115/140). Describe the source operations and load conditions, emissions controls, and emission unit locations. Be sure to identify all possible types of fuel(s) and/or process emissions (if applicable) that the emission source will be permitted to emit.
For each emission source (i.e., stack), the applicant should minimally provide logical tables with the following parameters necessary for model input:
• Name of stack/emission unit (please use a logical naming convention when naming stacks used in the modeling analysis)
• UTM coordinates of stack or emission source (lat/long coordinates will not be accepted). Also, identify the North American Datum (NAD27 or NAD83). NAD83 is preferred.
• Stack base elevation
• Stack emission rate(s) for all pollutants being modeled
• Stack flow and exit velocity
• Stack exit temperature (Kelvin)
• Stack height
• Stack-top inside diameter (NOTE: If the stack is not circular, use equivalent dimensions determined by AREA=πd2/4, where d is the stack's inner diameter.)
• Orientation of stack, if other than vertical (if applicable)
• Presence of rainhat, cap or other obstruction (if applicable)
Tables containing these parameters will be required for all stacks modeled in the analysis (all load cases and current actual/baseline stacks, if applicable).
Since most models are designed to accept metric units, the values for the above parameters must minimally be provided in metric units (meters, grams/second, meters/second, etc.), but it would be helpful to MEDEP-BAQ review to include values in both English and metric units.
For certain combustion sources (diesel generators, etc.), it is common for the stacks/vents to discharge in a horizontal or downward direction or to have attached rain caps. These orientations and obstructions will likely effect the overall plume rise/dispersion of the pollutants being emitted. Current EPA guidance should be used when modeling these stacks/vents. Additional information on this topic can be found at the SCRAM website by reading Model Clearinghouse Memo #89.
Geo-Referenced Data
It is required that all geo-referenced data (receptors, stack locations, etc.) be chosen in the same North American Datum (NAD). Either NAD27 or NAD83 data is acceptable, as long as all data is chosen from the same datum. It will be necessary to specify in the modeling protocol which datum you will be working with.
For any geo-referenced data supplied by MEDEP-BAQ for inclusion into the model, the datum will be clearly specified. Consultants working with GIS-based programs are encouraged to submit the data in NAD83.
Modeled Load Cases
A minimum of three (3) operating loads should be modeled: maximum licensed load case, a typical load case, and a minimum load case. This is to assess the sensitivity of predicted concentrations to plume rise as related to operating level, so as to determine the "worst-case" operating scenario that will lead to maximum ground-level concentrations of regulated pollutants. There may be certain types of emission sources that will only be operated at a single load, such as in standby mode or peaking condition. In these cases, modeling of less than three load cases may be appropriate.
In cases lacking "typical and minimum" loads, the effects of reduced plume rise may be assessed by modeling the maximum (100%) load, 75% of the maximum load, and 50% of the maximum load. Alternatively, a representative sampling of operating scenarios covering the range of reasonably expected loads and conditions may be evaluated so as to determine the "worst-case" or "maximum impact" operating scenario. For certain types of emission sources (e.g., combustion turbines), ambient air temperatures may need to be considered in identifying appropriate operating scenarios for modeling, since air temperature can have a significant effect on plume characteristics and emission rates. Similarly, for multi-fuel combustion sources, consideration may need to be given to which fuel is considered "worst-case" for each individual air pollutant.
For sources using backup fuel(s), it is likely that the fuel(s) which produces the highest emission rate for each pollutant should be used when determining emission rates for modeling purposes. However, since different fuels have different emission rates, heating values, stack exit velocities and stack temperatures, it is possible that the alternative fuel scenarios will need to be modeled as well.
If you are still having difficulty choosing representative typical and minimum load cases, you should consult with the appropriate MEDEP-BAQ project engineer or meteorologist for assistance prior to submitting the modeling protocol.
It is important to note that larger sources with multiple licensed configurations may have several maximum, typical and minimum load cases.
Significant Impact Level (SIL) Modeling
The applicant should conduct significant impact modeling (to be included in the modeling protocol) to:
- Determine if the impacts from the modeled source are significant/insignificant for any pollutant/averaging period.
- Justify proposed sources for combined source modeling.
- Determine operating scenarios to be included in the combined source modeling (traditionally, the maximum load case plus other load cases yielding higher impacts than those predicted by the maximum load case).
Since significant impact modeling is often performed prior to submission of the modeling protocol, it is suggested that the model user contact MEDEP-BAQ prior to performing the significant impact modeling, to review the intended model inputs on (minimally) an informal basis.
No further MAAQS or increment modeling will be necessary for a regulated pollutant if it is demonstrated through modeling that the applicant will not have a significant impact (as predicted with screening modeling or by using the most recent year of meteorological data in sequential modeling) on a pollutant/averaging period basis. If modeling results do not exceed significant impact levels over all averaging periods, no further modeling is required to demonstrate compliance for that pollutant (see table below for SIL values).
Further modeling may be necessary in instances where a regulated pollutant from a specific source is predicted by screening to exceed the significance level(s), ambient air quality standards or ambient increments.
Additional Sources
Based upon the results of the significant impact modeling, MEDEP-BAQ will ultimately be responsible for the final decision regarding off-site sources to be modeled. MEDEP-BAQ will typically provide the applicant with a list of any sources that may have to be included in the final modeling analysis and the model input data for these sources. This list will contain all data required for model input including source location(s), emission rates, stack parameters, and model-ready Building Profile Input Program (BPIP) input files or necessary building dimensions for the applicant to determine direction-specific building parameters.
If requested, MEDEP-BAQ will provide urban and rural regional background data for each of the four air quality control regions. These values can be found in the Background Air Quality section.
Building-Related Considerations
The presence of structures in the vicinity of a stack can influence the behavior of the plume emitted from that stack.
Therefore, for all sources (stacks), the applicant shall:
• Determine the GEP stack height
• Calculate building parameters
Stack heights used in modeling must conform to the requirements of Section 123 of the Clean Air Act and Chapter 116 (Word) of the MEDEP-BAQ regulations (relating to prohibited dispersion techniques).
A scaled plot plan of the facility that shows the location of each structure and stack must be included. The plan should also include: a north arrow, an accurate scale ruler, all structure heights, the facility boundaries and any fenced areas in/around the facility. Great care must be taken with photocopied plot plans that the scale is accurate and correct across the entire plot plan.
For buildings/tiers with peaked roofs, the height of peak is to be used as the height of the structure for GEP determinations.
GEP Stack Height Determination
The GEP stack height for each stack at the source shall be calculated according to the procedures outlined in the Guideline for Determination of Good Engineering Practice Stack Height (PDF). The only computer software programs that can be used for GEP stack height determinations are EPA's BPIP-PRIME or any equivalent EPA- approved commercially available software package. Under no circumstances will hand calculations be accepted.
The modeling for each stack that is below its corresponding GEP formula height must account for potential building wake effects. For each stack, all buildings that are large enough and close enough (generally a building that is located within 5L of the stack, where L is the lesser of the height or maximum projected width of that structure) to influence the stack should be considered in the GEP analysis (if you are in doubt about a structure, include it). The building or structure yielding the highest GEP height (i.e., the controlling structure) should be determined for each stack. Individual buildings should be "combined", if appropriate, in accordance with EPA guidance as part of the determination of GEP-formula height, controlling structure(s), and building parameters for model input. Complex structures (i.e., a building with multiple tiers, etc.) are to be entered into the BPIP program as a tiered structure, NOT as separate buildings. In addition, the applicant will be responsible for justifying the exclusion of structures from the BPIP analysis.
If it has been determined that the actual stack height is greater than the calculated GEP stack height, building effects are not to be considered in the modeling analysis. The stack height to be used in the modeling analysis shall be the lesser of the actual proposed stack height or 65 meters.
For more information: Guideline for Determination of Good Engineering Practice Stack Height. (PDF)Cavity Analysis
When using a model that incorporates the PRIME downwash algorithm, the model does not limit how close to the building you can place receptors. To predict concentrations in the near-wake (cavity) regime, receptors are to be placed at 10 meter intervals from the edge of the buildings out to approximately 150 meters.
Regardless of the model used, if the cavity area does not extend into ambient air (as defined by Chapter 116 (Word)), the cavity analysis may be omitted.
All cavity methodologies and techniques are to be included in the protocol and (if applicable) discussed with MEDEP-BAQ prior to performing the analysis.
Receptors
A detailed list of all receptors to be included in the screening/refined analyses is to be included in the protocol for MEDEP-BAQ review, as well as any topographic maps, site plans and/or data files necessary to check or recreate such receptors. Receptors that are to be included (but are not limited to): refined (Cartesian), critical intermediate/complex terrain and other special receptors (fence-line, fresh-air intake, etc).
Methodologies for choosing receptors will vary depending on the model being used. Basic guidance for selecting receptors can be found in the Screening Modeling and Refined Modeling sections.
Meteorology
The protocol must include a highly detailed discussion as to which meteorological data set is proposed for use in the analysis. The discussion should include (but not be limited to):
• Location/description of the collection site relative to the facility
• UTM Codinates and elevation of the collection site
• Period of record
• Meteorological parameters and instrument height(s)
• Number of hours and handling/substitution of missing data
• Single and joint recovery rates
• QA/QC procedures (for new database development)
The sources of all of the meteorological data used including surface data, cloud data and upper air data must be documented.
In addition, the protocol must provide a highly detailed description of the surface characteristics used in AERMET. MEDEP-BAQ will review the proposed surface characteristics prior to the processing of the meteorological database and submission of a modeling report.
Unless the dataset has been pre-approved by MEDEP-BAQ for use in the analysis, all raw, processed and diagnostic data files are to be submitted to MEDEP-BAQ in electronic form for consideration for approval.
The EPA document Meteorological Monitoring Guidance for Regulatory Modeling Applications (PDF) should be consulted for guidance on collection, processing and submittal of all meteorological data.
Surrounding Topography
The protocol should include a general description/discussion of the terrain surrounding the source(s) being modeled, including the location of any complex terrain such as major topographic features.
Land Usage Determination
USEPA, 40 CFR, Part 51, Appendix W specifies a procedure to determine whether land usage surrounding the modeled source is primarily urban or rural. Two methods that can be used for performing this procedure are based on:
1. land use classifications, and
2. population density
with the land use classification procedure being the recommended approach.
Land Use Procedure
The land use procedure classifies land use within an area circumscribed by a circle, centered on the source, with a radius of 3 kilometers. The following table acts as a guide to help define the specific types of land use and their corresponding descriptions as defined by Auer (1978). If land use types I-1, I-2, C-1, R-2, and R-3 account for 50 percent or more of the land use within 3 kilometers of the source, then the modeling regime is considered urban. Note that the residential and industrial areas are often the pink and purple-colored areas identified on USGS 7.5 minute topographic maps.
IDENTIFICATION AND CLASSIFICATION OF LAND USE TYPES (AUER 1978)
|
Type |
Use and Structure |
Vegetation |
|
I-1 |
Heavy Industrial Major Chemical, steel & fabrication industries; general 3-5 story buildings, flat roofs. |
Grass & tree growth extremely rare. Less than 5% vegetation. |
|
I-2 |
Light-Moderate Industrial Rail yards, truck depots, warehouses, industrial parks, minor fabrications; generally 1-3 story buildings, flat roofs. |
Very limited grass, trees almost totally absent. Less than 5% vegetation. |
|
C-1 |
Commercial Office & apartment buildings, hotels, 10 story heights, flat roofs. |
Limited grass & trees. Less than 15% vegetation. |
|
R-1 |
Common Residential Single family dwelling with normal easements; generally 1 story, pitched roof structures, frequent driveways. |
Abundant common lawns & light-moderate wooded. Greater than 70% vegetation. |
|
R-2 |
Compact Residential Single, some multiple, family dwelling with close spacing, generally 2 story, pitched roof structures; garages (via alley), no driveways. |
Limited lawn sizes & shade trees. Less than 30% vegetation. |
|
R-3 |
Compact Residential Old multi-family dwellings with close (2m) lateral separation; generally 2 story, flat roof structures; garages (via alley), no driveways. |
Limited lawn sizes, old established shade trees. Less than 35% vegetation. |
|
R-4 |
Estate Residential Expansive family dwelling on multi acre tracts. |
Abundant grass lawns & light wooded. Greater than 80% vegetation. |
|
A-1 |
Metropolitan Natural Major municipal, state or federal parks, golf courses, cemeteries, campuses; occasional single story structure. |
Nearly total grass & lightly wooded. Greater than 95% vegetation. |
|
A-2 |
Agricultural Rural |
Local crops (e.g., corn, soybeans). Greater than 95% vegetation. |
|
A-3 |
Undeveloped Uncultivated; wasteland. |
Mostly wild grasses & weeds, lightly wooded. Greater than 90% vegetation. |
|
A-4 |
Undeveloped Rural |
Heavily wooded. Greater than 95% vegetation. |
|
A-5 |
Water Surfaces Rivers; lakes. |
|
Population Density Procedure
The population density procedure uses the same 3-kilometer circle as described above. The population within the circumscribed area is determined from Census Bureau Enumeration District data. This population is divided by the area of the circle to give the population density around the source. If the population density exceeds 750 people/km2, the modeling regime is considered urban. Otherwise it is classified as rural.
Documentation of the Land Use Classification should be included in the protocol along with any maps and/or data used to make the determination.
Comparison To Class II Ambient Air Quality Standards And Increment Standards
If the total predicted maximum concentrations of all sources, with the addition of background data, does not exceed ambient air quality (MAAQS) or Class II increment standards (listed in the following table), then compliance will have been demonstrated and no further MAAQS or Class II increment modeling (on a pollutant-by-pollutant basis) will be necessary. All values listed are expressed in micrograms per cubic meter.
CLASS II MAAQS/NAAQS, PSD INCREMENT STANDARDS AND SIL TABLE
|
Pollutant |
Averaging |
MAAQS a |
NAAQS a |
Class II Increment Standard |
Class II SIL |
|
SO2 |
1- Hour |
- - - - |
196 b |
- |
10 c 25 g 5 g 1 g |
|
PM10 |
24-Hour |
- - |
150 i |
30 c |
5 g 1 g |
PM2.5 |
24-Hour Annual |
- - |
35 k 15 j |
9 4 |
1.2 f,g 0.3 f,g |
|
NO2 |
1-Hour |
- |
188 l |
- |
10 e,g 1 g |
|
CO |
1-Hour |
- - |
40000 d 10000 d |
- |
2000 g 500 g |
|
Cr |
24-Hour |
0.30 0.05 |
- |
- |
- |
|
Pb |
24-Hour |
1.5 b - |
- |
- |
- 0.1 m |
a Primary standard unless otherwise noted
b The 3-year average of the 99th percentile of the daily maximum 1-hour concentration must not exceed standard
c Interim Significant Impact Level (SIL) adopted by Maine DEP
d One exceedance allowed per year
e Secondary standard
f Interim Significant Impact Level (SIL) adopted by NESCAUM states
g No exceedances allowed
h The 24-hour and annual SO2 NAAQS were revoked. However, the corresponding MAAQS, increment standards, and SILs remain in effect.
i Expected number of days per calendar year with arithmetic time-averaged concentration above standard is equal to or less than one.
j Based on 3-year average of the annual concentrations
k The 3-year average of the 98th percentile of 24-hour concentrations must not exceed standard. The NAAQS was revised effective December 18, 2006
l The 3-year average of the 98th percentile of the daily maximum 1-hour concentration must not exceed standard.
m Rolling 3-month average, no exceedances allowed.
Class I Analysis
For any major new source or any major modification (to an existing major or minor source), it is possible that a Class I increment and/or Air Quality Related Value (AQRV) analysis may need to be performed, as requested by the affected Federal Land Manager(s) of the four designated Class I areas in/near Maine. Current Class I increment standards and significance levels are listed in the following table:
|
Pollutant |
Averaging Period |
Class I Increment Standards |
Class I Significance Levels (µg/m3) |
|
SO2 |
3-Hour |
25 |
1.00 |
PM10 |
24-Hour Annual |
10 5 |
0.40 0.20 |
|
PM2.5 |
24-Hour |
2 |
0.07 |
|
NO2 |
Annual |
2.5 |
0.10 |
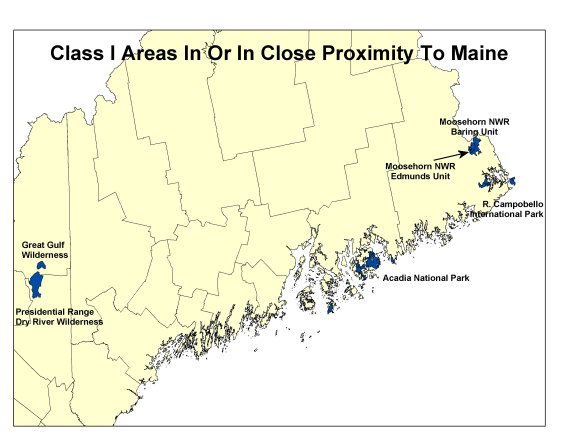
The locations of the four Class I areas (Acadia National Park, Roosevelt-Campobello International Park, Moosehorn National Wildlife Refuge and Dry River-Great Gulf Wilderness Area) can be found below:
In the modeling protocol, it is necessary to include a brief discussion of any modeling that will be performed to assess AQRV impacts in or near a designated Class I area. In order for the Federal Land Manager to make a determination as to the level of analysis necessary (if any), the following information will need to be provided to MEDEP-BAQ:
• Description/Scope of the proposed new source or modification.
• Proposed emissions increase resulting from the new source or modification.
• Distance (in kilometers) from the source to all affected Class I Areas.
• Potential for additional source growth in the area/region.
MEDEP-BAQ will then forward this information to the appropriate FLM for consideration. Typically, the FLMs have 30 days to make a determination as to the level of modeling necessary (if any) to demonstrate compliance.