DACF Home → Bureaus & Programs → Maine Geological Survey → Maps, Publications and Online Data → Using Geologic Maps → Reading Significant Sand and Gravel Aquifer Maps
Reading Significant Sand and Gravel Aquifer Maps
What's on the maps?
Surficial deposits with the potential to yield more than 10 gallons per minute are outlined on Significant Sand and Gravel Aquifer Maps. Yield and depth information about existing wells, springs, and test borings is also shown.
Uses of the maps
Sand and gravel aquifer maps are useful in two major categories of decision-making: ground-water supply and ground-water protection.
- Ground-water supply
- these maps are useful in locating areas favorable for developing water supplies for municipal, industrial, or residential use. Information on the map, such as depth to bedrock and well yield, indicate the potential for ground-water production. High-yield municipal wells are constructed primarily in gravel deposits from which yields of 500-1000 gpm are possible. The location of sand and gravel aquifers can influence where a well driller locates a well, and what type of well is constructed.
- Ground-water protection
- Knowledge of the location and extent of sand and gravel aquifers is critical when siting potential contamination sites such as landfills, underground storage tanks, or salt storage facilities. The Maine Department of Environmental Protection prohibits siting these potential contamination sites on areas mapped as significant sand and gravel aquifers.
- If ground-water contamination occurs, the general trend of the plume migration can be deduced from these maps by analyzing the drainage basin boundaries and the local surface water bodies.
- When used in conjunction with other geologic information, this map can help planners and municipal officials make much more informed decisions to guide industrial growth or residential development. Aquifer maps and texts from the Maine Geological Survey contain information on aquifer favorability and vulnerability and are widely used by local and state officials in making environmentally sound siting decisions, and by well drillers, developers, and geological consultants as a base for detailed hydrogeological studies.
Definitions
Understanding the following terms will help you interpret what you see on a sand and gravel aquifer map.
What is an aquifer?
An aquifer is a water-bearing geologic formation capable of yielding a usable amount of ground water to a well. There are two types of aquifers in Maine: surficial materials and fractured bedrock. In unconsolidated surficial deposits the water fills the pore spaces between the rock fragments that make up the deposits. Coarse-grained surficial materials such as sand and gravel are capable of transmitting large quantities of ground water and are generally the most productive ground water resources in the State. For more detailed information, read the map sidebar (pdf).
What is ground water?
Ground water, as the name implies, is water found below the land surface in the pore spaces between sand grains and in fractures in the bedrock. The water table is the level below which all the pore spaces are filled with water. The area below the water table is called the saturated zone, while the area above the water table, where the pore spaces are filled partly with water and partly with air, is called the unsaturated zone. If you have a dug, driven point, or gravel-packed well the static water level in your well corresponds to the water table.
What are surficial materials?
Geologic processes such as weathering and erosion break bedrock down into smaller particles of sediment. Sediments such as clay, silt, sand, gravel, and other loose deposits which lie on top of bedrock are grouped together in the general category of "surficial materials." These materials are not soils; they are the deeper earth materials that lie between the soil zone and the underlying bedrock. Soils commonly develop by weathering of the uppermost part of these materials. Refer to the fact sheet "Introduction to Surficial Materials" for images of the textures of materials found in Maine.
What is a significant aquifer?
A significant ground water aquifer, as defined by the Maine State Legislature (38 MRSA Chapter 3, Section 482, 4-D) is "...a porous formation of ice-contact and glacial-outwash sand and gravel or fractured bedrock that contains significant recoverable quantities of water which is likely to provide drinking water supplies."
In 1980 the Legislature directed the Maine Geological Survey (MGS) and the Maine Department of Environmental Protection (MDEP) to gather information on sand and gravel aquifers, including data on depth to bedrock, depth to water table, stratigraphy, and water quality (38 MRSA Chapter 3, Section 403). The bill further instructed the MGS and MDEP to identify all sand and gravel aquifers capable of yielding more than 10 gallons per minute of ground water to a properly installed well. Significant Sand and Gravel Aquifer maps are the product of that effort.
Tips for Reading the Maps - Aquifer Boundaries
What are the colored areas on the map?
The yellow and orange colored areas on the map indicate water-bearing sand and gravel deposits where ground-water yield is estimated to be 10 gallons per minute (gpm) or greater (Figure 1). The boundaries of the aquifers are drawn by a geologist based, in part, on the well data shown on the aquifer map, and on areas of sand and gravel shown on surficial geology and surficial materials maps. Areas not mapped as aquifer may be thin or unsaturated sand and gravel deposits, surficial deposits other than sand and gravel, or bedrock. Read the map explanation (pdf) for a more detailed description of the map units.
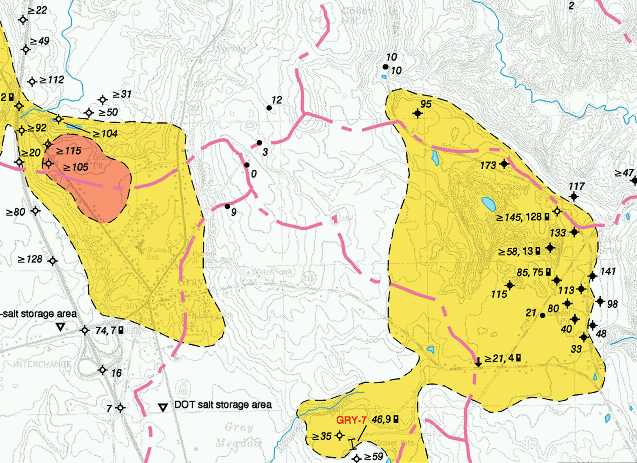
Figure 1. Portion of the Gray quadrangle, Significant Sand and Gravel Aquifer map series. The orange area is a high-yield zone (>50 gpm) and the yellow areas are moderate-yield zones (10-50 gpm). Read the map explanation (pdf) for a more detailed description of the map units.
How accurate are the aquifer boundaries?
The accuracy of the aquifer boundaries depends on the amount of data collected in the area, such as test hole logs, seismic lines, and well logs. By looking at the aquifer map (Figure 2a), along with the related surficial geology (Figure 2b) and materials maps (Figure 2c), you can get an idea of how well-constrained the aquifer boundaries are. The boundaries of the aquifer mapped in the examples below will give you an idea of how to interpret their accuracy. The blue line on the surficial geology (Figure 2b) and materials map (Figure 2c) is the outline of the significant aquifer. In areas with little subsurface information the aquifer boundaries are more subjective, and it is possible that fine-grained sediments or till may overlie favorable coarse-grained sediments and the deposit may not be recognized as aquifer.
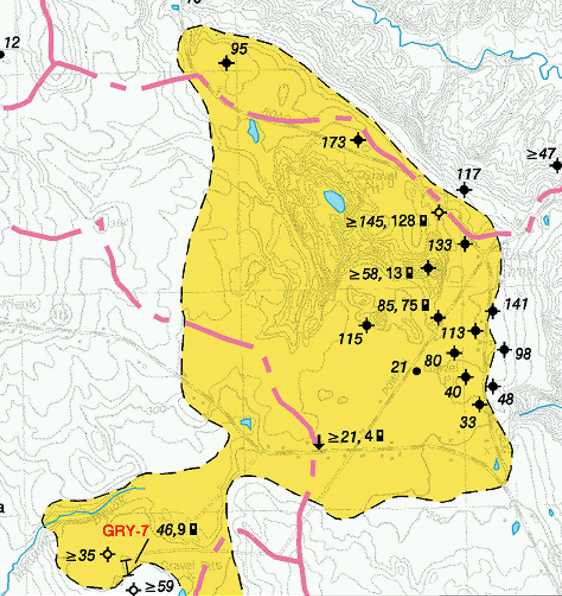
Figure 2a. Portion of the Gray quadrangle, Significant Sand and Gravel Aquifer map series. Note the number of data points (observation wells and test borings) along the eastern boundary of the aquifer. In contrast, there is no subsurface information along the western boundary of the aquifer. As a result of the density of information, the eastern boundary can be considered more "accurate" than the western boundary. The western boundary is based on more subjective information such as an interpretation of topography and other surficial geologic indicators. Refer to Figure 2b and Figure 2c for more information on aquifer boundaries.
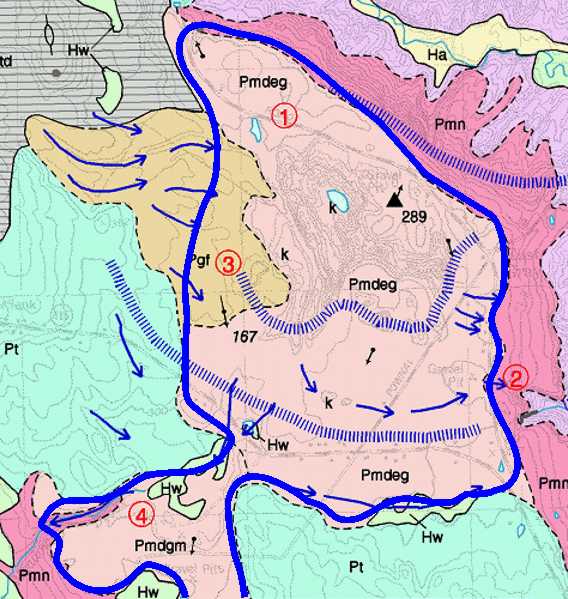
Figure 2b. Portion of the Gray quadrangle, Surficial Geology map series. Notice how closely the aquifer boundary follows the sand and gravel formations (Pmdeg, Pmdgm, Pgf) shown on the surficial geology map. Refer to Figure 2a and Figure 2c for more information on aquifer boundaries.
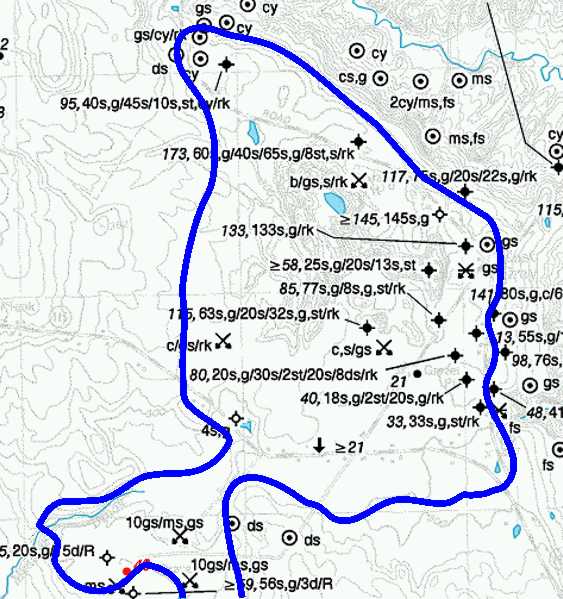
Figure 2c. Portion of the Gray quadrangle, Surficial Materials map series. The materials map shows the data used to construct the surficial geology map. As in Figure 2a, note the number of data points (observation wells and test borings) along the eastern boundary of the aquifer. In contrast, there are only a few points along the western boundary of the aquifer. As a result of the density of information, the eastern boundary can be considered more "accurate" than the western boundary. The western boundary is based on more subjective information such as an interpretation of topography and other surficial geologic indicators. Refer to Figure 2aand Figure 2b for more information on aquifer boundaries.
Is it possible for the aquifer boundaries to change on new editions of the map?
The areas shown as significant aquifers represent the geologist's best interpretation based on the data available at the time the map was published. With the addition of new data, the interpretation of the aquifer boundaries may change. Observe the changes to the aquifer boundaries in Figure 3. Note especially how the high-yield zones have reduced in size over the years as more information was acquired.
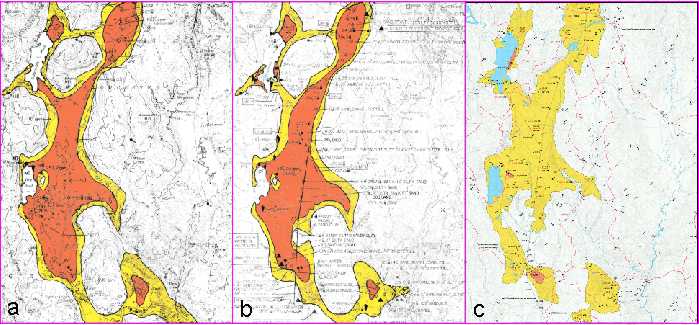
Figure 3. Change in interpretation of aquifer boundaries over time. 3a. 1979 sand and gravel aquifers map (scale 1:50,000). 3b. 1985 significant aquifers map (scale 1:50,000). 3c. Current edition of significant aquifers map, published in 1999 (scale 1:24,000). Note how the interpretation of aquifer boundaries has changed as more data was collected. Note especially how the high-yield (red) areas have shrunk, representing a more conservative estimate of the potential yield of the aquifer. For a more detailed discussion, read Sand and gravel aquifer maps - A work in progress.
It is important when using an aquifer map to use the most recent edition available (Figure 4) due to continuing data collection and the resulting changes in aquifer boundary interpretation over time. The online maps on the MGS website are the most recent editions.
Figure 4. Title block from a Significant Sand and Gravel Aquifers map. Note the open-file number and date in the lower right corner.
Are all sand and gravel aquifers shown on the map?
Only "significant" sand and gravel aquifers are shown on the map. "Significant" aquifers have a projected yield of over 10 gallons per minute. Areas not mapped as aquifer may be thin or unsaturated sand and gravel deposits. If the thickness of the coarse-grained material below the water table does not exceed 10 feet, a well in that material would not be able to sustain a yield of 10 gpm, so the area would not be mapped as aquifer. In some areas, a thin cover of favorable coarse-grained material may overlie fine-grained sediments, till or bedrock. In other areas, it is possible that fine-grained sediments or till may overlie favorable coarse-grained sediments and the deposit may not be recognized as aquifer.
Do other surficial materials contain water?
Other surficial materials such as glacial till or marine silt and clay do contain water below the water table. However, a well in these materials would not have a very high yield due to the low permeability of the deposit (for more information, read the map sidebar (pdf)).
Tips for Reading the Maps - Map Symbols
What do the map symbols represent?
The symbols shown on the aquifer map (seismic profiles, well data, pollution sources, etc.) and the materials map (test pits, auger holes, etc.) represent the ground-water related data used to interpret the aquifer boundaries. A high density of data points indicates an area where the aquifer boundary is more accurately located. For more information, read the aquifer map explanation (pdf) or the materials map explanation (pdf).
What does the seismic refraction information tell me?
Seismic refraction profiling reveals subsurface information about the depth to the water table, the depth to bedrock, and bedrock surface topography. Geologic cross sections generated from seismic information are shown in associated reports listed in the references below the map. The presence of seismic profiles in an area shown as aquifer increase the reliability and accuracy of the geologist's interpretation. For a more detailed discussion, read Seismic refraction profiling: An important tool used in mapping sand and gravel aquifers.
What information can I get from the map symbols?
The well data on the map provide information about the depth to bedrock, depth to water table, yield, and type of well. The depth to bedrock number shows the thickness of surficial materials. Depth to water table shows whether or not the deposit is saturated. Well yield gives information about existing water wells. This information is useful when making decisions about water supply, a drainage plan, or the need for blasting. (Figure 5)
Figure 5. The well data symbols.
Why are the drainage basin lines plotted on the map?
The horizontal direction of ground-water flow is generally away from drainage divides and toward surface-water bodies. This is important with respect to ground-water contamination. Aquifers in surficial materials are especially sensitive to contamination from spills of hazardous chemicals. Contamination plumes in sand and gravel aquifers will follow the flow of ground water away from the divides, towards the nearest surface water. Wells located in the path of the plume would become contaminated.
Tips for Reading the Maps - Related Maps
How does the significant aquifers map relate to surficial materials and surficial geology maps?
Surficial materials maps show the actual field observations which help locate sand and gravel deposits. The geologist uses this information, in addition to air photos, topographic maps, soils maps, and wetlands maps to compile the surficial geology map. The aquifer mapper begins with the materials and surficial geology information and decides which of the sand and gravel deposits have the potential to be "significant" aquifers. In the end, the significant aquifer maps show a subset of the sand and gravel deposits mapped on the surficial geology map.
More Information
For more information on Maine's ground water and aquifers, refer to the following pages:
For further assistance in interpreting this map, contact a geologist at the Maine Geological Survey.
Last updated on January 20, 2011