DACF Home → Bureaus & Programs → Maine Geological Survey → Hazards → Living Shorelines Decision Support Tool → FAQ
Living Shorelines Decision Support Tool for Casco Bay - Frequently Asked Questions
- Q1. How do I use this viewer?
- Q2. What data is visualized in this viewer?
- Q3. What datasets were used to compile this information?
- Q4. What are the limitations or assumptions of this data?
Q1. How do I use this viewer? Back
To use the viewer, either zoom in on the map to your area of interest, either manually click the  keys on the left of the viewer tab), or by typing in an address or place and hitting the search tab
  . You can also zoom in or out by using the scrolling wheel on your mouse, if you have one. You can convert the Viewer into Full Screen mode by clicking on “View Map Full Screen” tab directly below the viewer home page.
To turn certain specific data layers on or off, simply click the data layers tab  and place a checkmark in the appropriate data layers you want to view.
When zooming, available data layers will automatically zoom with you. To get more information on a specific point, simply click on that feature to extract information as described below in What data is visualized in this viewer?
Data descriptions, data disclaimers, and frequently asked questions are also available on the webpage below the viewer.
Q2. What data is visualized in this viewer? Back
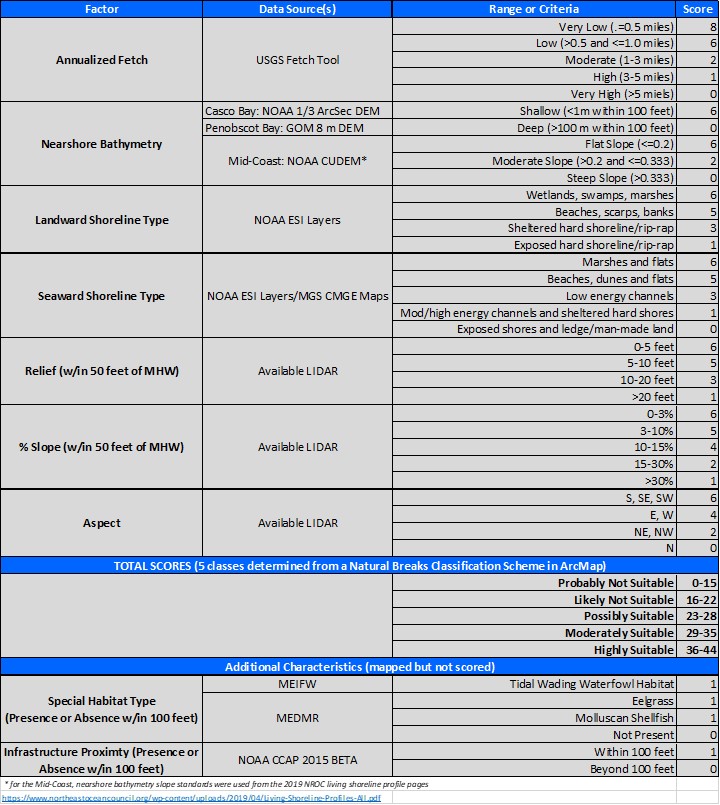
Living Shoreline Suitability Scores – a color-coded point file (approximately 50 foot spacing in Casco Bay and 200 foot spacing along the Mid-Coast shoreline) along the shoreline representing the potential suitability of that stretch of shoreline for living shoreline approaches. Each point is a combined (cumulative) score of different key factors that influence the suitability of the shoreline for green infrastructure approaches using the scoring system shown in Table 1. Factors include:
- Annualized fetch (the dominant direction and percent time over the year the wind comes from that direction);
- Nearshore bathymetry (the depth of water within 100 feet of the shoreline);
- Landward shoreline type (the dominant landward shoreline type);
- Seaward shoreline type (the dominant seaward shoreline type);
- Relief (the relief of the shoreline 50 feet landward of the mean high water line);
- Percent slope (the percent slope of the shoreline 50 feet landward of the mean high water line); and
- Aspect (the direction which the shoreline faces).
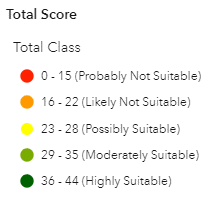
Using this classification, points were color-coded and classified as follows:
If you click on an individual point, attributes include those factors listed in Table 1 and their associated “score”, which represents the range (or criteria) for each factor, including:
- Total Score (combined total score, out of a maximum of 44 points)
- Total Class (classification for the Total Score)
- Fetch Score (score for the annualized fetch at the point)
- Fetch Class (classification for the Fetch Score)
- Bathymetry Score (score for the nearshore bathymetry 100 feet seaward of the point)
- Bathymetry Class (classification for the Bathymetry Score)
- Landward Shoreline Type Score (score for the landward shoreline type at the point)
- Landward Shoreline Type Class (classification for the Landward Shoreline Type Score)
- Seaward Shoreline Type Score (score for the seaward shoreline type at the point)
- Seaward Shoreline Type Class (classification for the Seaward Shoreline Type Score)
- Relief Score (score for the relief of the land within 50 feet landward of the point)
- Relief Class (classification for the Relief Score)
- Slope Score (score for the slope of the land within 50 feet landward of the point)
- Slope Class (classification for the Slope Score)
- Aspect Score (score for the aspect at the point)
- Aspect Class (classification for the Aspect Score)
The presence or absence of several different habitat types or infrastructure within 100 feet of the point are included in the viewer, but not included in total scoring. These include:
- Tidal Wading Bird and Waterfowl Habitat Score (presence (1) or absence (0) within 100 ft of the point)
- Eelgrass Beds Score (presence (1) or absence (0) within 100 ft of the point)
- Shellfish Score (presence (1) or absence (0) within 100 ft of the point)
- Structures Score (presence (1) or absence (0) of developed land within 100 ft of the point)
Note that points representing each factor, as described below, can also be turned on or off in the viewer.
Q3. What datasets were used to compile this information? Back
Table 1 shows the data sources used to compile the living shoreline suitability scores. Each data source is described further herein. Please note that you can view the overall living shoreline suitability score (cumulative score) or each individual factor by clicking the different data layers on and off.
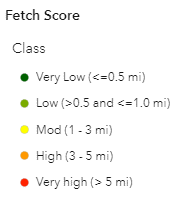
Annualized Fetch. Fetch, which is the distance of water over which wind can below before it hits land, can be used as a proxy for exposure of the coastline to wave attack. Exposure of a shoreline to large fetches means that more wave energy can hit a section of shoreline as opposed to smaller fetches. Annualized fetch is the direction and percentage of time that the wind blows from that direction over the course of an average year. Annualized fetch is a key factor in determining whether or not a section of shoreline is suitable for living shoreline approaches. The USGS Fetch Tool, an ArcGIS extension, was used to calculate the annualized fetch for shorelines in Casco Bay, ME. Ten-minute wind data available from the National Data Buoy Center’s Station 44007 for a twenty year period (2006-2015) was used to calculate a wind rose to determine the percent-time (during the average year) that the wind blew from a certain direction. This data was then used to create an annualized table which was input into the fetch tool. Using this annualized information and land and water boundaries within Casco Bay, the tool was then applied in order to calculate the distance over which wind can blow before it hits a land boundary under annualized wind conditions. Outputs were then grouped into several different classes and scored as follows: Very Low (<=0.5 miles, 8 points); Low (>0.5 and <=1.0 miles, 6 points); Moderate (1 to 3 miles, 2 points); High (3 to 5 miles, 1 point) and Very High (>5 miles, 0 points) and color-coded as follows:
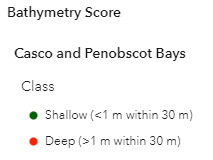
Nearshore Bathymetry. One of the other most important factors regarding living shoreline suitability is nearshore bathymetry. That is, how deep the water is adjacent to a shoreline. Nearshore bathymetry is also another indicator for potential wave exposure, as waves typically can be bigger in deeper water rather than shallower water. Shallower water is more conducive to breaking up wave energy and supports habitat types that are more amenable to living shorelines such as mudflats, beaches, marshes, dunes, and lower coastal bluffs. Deeper water allows more wave energy to be transferred to shore and creates more difficulty to build a living shoreline.
For Casco Bay, a 1/3 arc-second bathymetric digital elevation model (DEM) was downloaded from NOAA’s National Ocean Service and adjusted to NAVD88 using NOAA’s VDATUM tool.
For Penobscot Bay, a 16-meter digital elevation model was downloaded from the Northeast Ocean Data Portal and elevations converted to NAVD88 using VDATUM.
100-feet seaward of each point, the depth was extracted and classified as either Shallow (<=1m deep, 6 points) or Deep (>1m deep, 0 points). The feature point class was color-coded as follows:
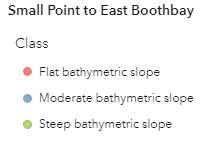
For the Mid-Coast region, a digital elevation model was downloaded from the National Centers for Environmental Information Bathymetric Data Viewer and data converted to NAVD88. 100 feet seaward of each point, the depth was extracted and compared with the elevation of the original point to determine a bathymetric slope. Using a classification scheme from the NROC Living Shoreline Profile Pages, points were classified as flat bathymetric slopes, moderate bathymetric slopes, and steep bathymetric slopes and color coded as follows:
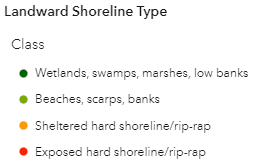
Landward Shoreline Types. The type of habitat landward of the shoreline plays a large role in the suitability for living shoreline approaches. For example, if a landward shoreline type is a low coastal bluff or marsh, it is likely easier to integrate a living shoreline as opposed to if the shoreline is comprised of granite outcrops or a seawall. In order to determine landward shoreline type along a shoreline, a 2016 Environmental Sensitivity Index (ESI) GIS data layer from NOAA’s Office of Response and Restoration was used. This layer includes a variety of classifications of the shoreline type landward of the approximate mean high water line. Data was classified as follows:
- Salt and brackish water marshes, freshwater marshes, swamps, shrub-scrub wetlands, and vegetated low banks were given 6 points, the highest score.
- Fine to medium grained sand beaches, coarse grained sand beaches, mixed sand and gravel beaches, gravel beaches, sheltered scarps (mud/clay) were given 5 points. These shoreline types are slightly higher energy but very amenable to living shoreline approaches.
- Sheltered impermeable rocky shores, sheltered solid man-made structures, and sheltered rip-rap were given 3 points because they are in a sheltered environment, but less conducive to living shoreline approaches than the above types.
- Exposed rocky shores, exposed solid man-made structures, exposed wave-cut platforms (rocky), and exposed rip-rap were given 1 point, indicating the lowest suitability for a living shoreline approach due to high exposure.
The feature point class was color-coded as follows:
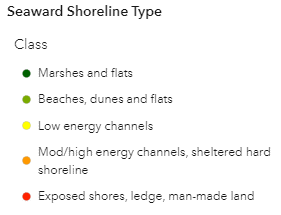
Seaward Shoreline Types. Similar to landward shoreline types, the type of habitat seaward of the shoreline plays a large role in the suitability for living shoreline approaches. For example, if a seaward shoreline type is a beach or mudflat, it indicates that conditions are suitable for natural growth of such features, indicating a living shoreline would likely be effective. Conversely, if the seaward shoreline type was rocky ledge, that indicated a higher energy environment or one less conducive. The same 2016 Environmental Sensitivity Index (ESI) GIS data layer from NOAA’s Office of Response and Restoration was used. However, it was found this layer was largely incomplete for certain areas. Thus, this was supplemented with shoreline types extracted from the MGS Coastal Marine Geologic Environments (CMGE) layer. Data was classified as follows:
- Marshes and flats. ESI (exposed tidal flats, sheltered tidal flats, vegetated low banks) and CMGE (fresh-brackish marsh, fluvial marsh, salt pannes and ponds, low salt marsh, high salt marsh, mud flat, eelgrass flat, seaweed community, mussel bars). These received 6 points, the highest score.
- Beaches, dunes, and flats. ESI (Fine to medium grained sand beaches, coarse grained sand beaches, mixed sand and gravel beaches, gravel beaches, sheltered scarps (mud/clay)) and CMGE (sand beach, mixed sand and gravel beach, gravel beach, boulder beach, low energy beach, boulder ramp, spits, washover fan, swash bars, dunes and vegetated beach ridges, upper shore face, coarse grained flats) were given 5 points. These shoreline types are slightly higher energy but very amenable to living shoreline approaches.
- Low energy channels. CMGE (tidal fluvial channels, abandoned tidal channels, estuarine channels, low velocity tidal channels) were given 3 points.
- Mod/high energy channels, sheltered hard shoreline. ESI (Sheltered impermeable rocky shores, sheltered solid man-made structures, and sheltered rip-rap) and CMGE (medium velocity channels, high velocity channels, dredged channels) were given were given 1 point.
- Exposed shores, ledge, man-made land. ESI (Exposed rocky shores, exposed solid man-made structures, exposed wave-cut platforms (rocky), and exposed rip-rap) and CMGE (ledge or man-made land) were given 0 points.
The feature point class was color-coded as follows:
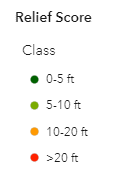
Relief. Relief is the difference in height between the high point and low point on a landscape. Relief is an important factor in that it gives an indication of how much elevation occurs landward of the high water line. In general, it’s easier to construct a living shoreline along a stretch of shoreline with lower relief than it is with higher relief, and higher relief shorelines may be more difficult to stabilize. MGS used available LIDAR data and cast transects landward 50 feet of each individual shoreline point, and calculated the difference between the elevation of a point 50 feet landward and the mean high water elevation. These were then classified as follows: 0-5 feet above MHW = 6 points; 5-10 feet above MHW = 5 points; 10-20 feet above MHW = 3 points; 20+ feet above MHW = 1 point. The feature point class was color-coded as follows:
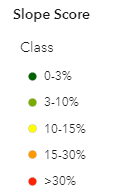
Slope. Slope is the relief divided by the distance (“rise over run”). Shallower slopes, in general, are more conducive to naturally occurring living shorelines (such as wetlands, beaches, or low bluffs) than higher slopes, which likely would need a high degree of modification. For this dataset, slope was calculated by taking the relief and dividing by the distance inland (50 feet) from the mean high water line. This resulted in the following classifications: 0-3% (6 points); 3-10% (5 points); 10-15% (4 points); 15-30% (2 points); and >30% (1 point). The feature point class was color-coded as follows:
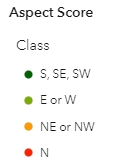
Aspect. Aspect is the dominant direction that the shoreline faces. Because of higher sun exposure, vegetation (marsh grasses, shrubs, etc.) typically grow best on south facing aspects, and worst on north facing aspects. This is a generality for most species, but please note that certain types of vegetation can certainly be specified which favor specific aspects. LiDAR data was used to determine the aspect of the shoreline at each point, and classified as follows: south, southeast or southwest (6 points); east or west (4 points); northeast or northwest (2 points); north (0 points). The feature point class was color-coded as follows:
Special Habitat Types. The viewer also enables users to inspect proximity of the shoreline to (within 100 feet) several different mapped special habitat types such as Tidal Wading Waterfowl, Shellfish, and Eelgrass beds. A presence of these habitats within 100 feet of the shoreline point is indicated by a 1 (for each habitat), while if it is absent, 0. Note that these factors are not included in scoring and don’t have individual feature point classes but is available to view when clicking on a point.
Proximity to Structures. The viewer also enables users to inspect the proximity of structures (within 100 feet) of the shoreline. This data was developed using NOAA CCAP 2015 BETA10-meter impervious data. A presence of a structure (house, building, road, etc.) within 100 feet of the shoreline point is indicated by 1, while if it is absent, 0. Note that this factor is not included in scoring and doesn’t have an individual feature point class but is available to view when clicking on a point.
Q4. What are the limitations or assumptions of this data? Back
The supporting datasets were developed at different times and each only represents a static (or “snapshot”) of conditions at the time the data was developed. For example, land topography, nearshore bathymetry, or shoreline conditions may have changed since the data representing those factors was developed, interpreted, and analyzed.
Also, please recognize that this viewer and the data presented herein is meant for planning purposes only. Although the viewer can provide the general suitability of a shoreline for a living shoreline approach, this decision should be made in consultation with a qualified professional.
Last updated on January 24, 2023