DACF Home → Bureaus & Programs → Maine Geological Survey → Explore Maine Geology → Ground Water and Wells → Withdrawal Regulations → Final Report → Risk Analysis
Review and Recommendations Regarding Ground Water Regulations
Watersheds-at-risk Analysis
Maine Geological Survey conducted a preliminary analysis of watersheds at risk. This instructive analysis was made possible by public investments over the past decade in important datasets and analyses including a statewide digital compilation of watersheds, analysis by the U.S. Geological Survey (USGS) of typical annual and monthly stream flows in Maine, and water-use reporting. It is important to note that the in-stream flows required by the provisionally adopted flow rules are a major component of the water demand in each watershed.
Analysis
For this preliminary analysis, a "watershed-at-risk" is defined as a watershed where the sum of the required in-stream flows plus the consumptive water withdrawals exceeds some percentage of the total runoff generated within the watershed. The analysis assumes that:
- The long-term average water resource available within a watershed is equal to the longterm average annual runoff from the watershed. The annual runoff from a watershed is the volume of surface water that flows from a watershed on a yearly basis. From a simple mass balance equation in a watershed with no consumptive water use, it is equal to
annual precipitation - loss from evaporation - loss from plant transpiration
The evaporation and plant transpiration terms are usually combined to give
annual precipitation - loss from evapotranspiration
(A small volume of groundwater may also flow from a watershed, but will be ignored in this analysis.) - This net runoff must supply the minimum in-stream flow requirements for the watershed as defined in provisional in-stream flow rules adopted by the Board of Environmental Protection (BEP) plus any consumptive water use in the watershed.
- The analysis includes both surface water and ground water withdrawals for consumptive use. A watershed with significant surface water withdrawals will be at risk from subsequent groundwater withdrawals even if those groundwater withdrawals alone do not constitute a significant percentage of the runoff generated within the watershed.
- This preliminary analysis does not consider cumulative in-stream flow from upstream watersheds in excess of minimum in-stream flow requirements. The result of this simplification is that the analysis will overestimate the impacts of direct withdrawals from the major rivers and streams within a watershed. It will not affect the analysis for headwater watersheds.
Sources of data
- The Natural Resources Conservation Service (NRCS) 12-digit Hydrologic Unit Code (HUC) watersheds were used for comparing net runoff to minimum in-stream flow requirements plus consumptive water use. This data set was selected as a compromise between detail and available water use data. The state is divided into 973 watersheds, ranging in size from less than 1 square mi to approximately 275 sq miles, with an average watershed size of 35 square miles.
- The long-term average annual runoff generated in a watershed was estimated from a regional regression equation developed by the US Geological Survey (USGS) (Dudley, 2004)
Qann = 1.151(A0.991)(100.023*pptW)
where Qann is the annual runoff in cubic feet per second (CFS), A is the watershed area in square miles, and pptW is the mean winter precipitation in inches of water.
The area of the watershed was obtained from a digital version of the NRCS 12-digit HUC watersheds; the mean winter precipitation was obtained from a climate dataset maintained by the NRCS that was used by the USGS in developing the regression equation. - The minimum required in-stream flow for a watershed was initially estimated from regional regression equations for monthly median flows developed by the US Geological Survey (Dudley, 2004) and cited in the provisional in-stream flow rules adopted by the BEP.
In some cases, the weighted sum of the estimated monthly median flows required in the provisional in-stream flow rules exceeded the estimated average annual runoff. This is because these regional regression equations for monthly median flow were developed independent of the equation for average annual runoff and from each other and may have uncertainties exceeding ±30 percent.
On average, however, the weighted sum of the estimated monthly median flows required in the provisional in-stream flow rules was approximately 65 percent of the average annual runoff. This finding is significant in and of itself: the provisional in-stream flow rules require that, on average, 65 percent of the runoff generated in a watershed must remain in the stream and is not available for any consumptive use. This value of 65 percent of the average annual runoff was used as the minimum required in-stream flow for all watersheds in the analysis. - Consumptive water use was estimated as the sum of:
- Public water supply withdrawals as reported to the Public Utilities Commission.
- Reported water use by other major water users as required by the water withdrawal program established by the legislature in 2002.
- Estimates of withdrawals by smaller water users regulated by the Drinking Water Program in the Department of Health and Human Services.
- Agricultural water withdrawals as reported to the Department of Agriculture, Food and Rural Resources. This data was provided as aggregate data in 10-digit or larger HUC watersheds, and where necessary was counted in multiple 12-digit HUC watersheds.
- Private domestic water use estimated from 1990 Census data on percent of households on private wells (the latest data of this type available) and 2000 Census population data.
A "watershed-at-risk" was defined as a watershed where the sum of the minimum required in-stream flow plus the estimated consumptive water use was equal to or greater than some arbitrary threshold percent of the estimated average annual runoff generated in the watershed.
Figure 1 and Figure 2 show watersheds-at-risk for arbitrary threshold values of 80-percent of the average annual runoff and 90-percent of the average annual runoff generated in the watershed. "Watersheds-at-risk" are shaded in gray on the two maps.
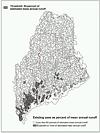 Figure 1 |
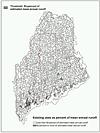 Figure 2 |
A number of watersheds exceed the 80- and 90-percent threshold values on the two maps. A total of 69 watersheds have minimum required in-stream flow plus estimated consumptive water use equal to or greater than 80 percent of the average annual runoff generated in the watershed. The total area above the 80 percent threshold is slightly over 2000 square miles, but because of the size of the NRCS 12-digit HUC watersheds, the actual impacted area is less than this. At a threshold of 90 percent of the average annual runoff generated in the watershed, 11 watersheds have minimum required in-stream flow plus estimated consumptive water use equal to or greater than the threshold. The total area impacted is 245 square miles, which again is probably larger than the actual area impacted.
Three watersheds (1 in Androscoggin County and 2 in Cumberland County) have the sum of minimum required in-stream flow plus consumptive water use actually exceeding the estimated annual runoff generated in the watershed, and only by less than 10 percent of the estimated average annual runoff. However, given the assumptions and uncertainties in the analysis, this result should only be taken as a flag to examine the water budget of these watersheds in more detail.
Overall, the results confirm what we know - at this time there is no crisis where many watersheds have flow requirements and withdrawals far exceeding sustainable levels. There are watersheds that bear more detailed study, however.
For both threshold values, the majority of watersheds-at-risk are in areas with relatively high population densities. This suggests that, at this level of analysis, areas undergoing rapid development and population growth are most likely to experience problems with non-sustainable water withdrawals in the future.
At the aggregate level the data was provided to us, agricultural water withdrawals do not appear to a problem.
Introduction Meetings Issues Tabled Items Risk Analysis Recommendations Costs Appendices
Last updated on February 1, 2007