DACF Home → Bureaus & Programs → Maine Geological Survey → MGS Collect → Beach Profiling
Southern Maine Volunteer Beach Profile Monitoring Program
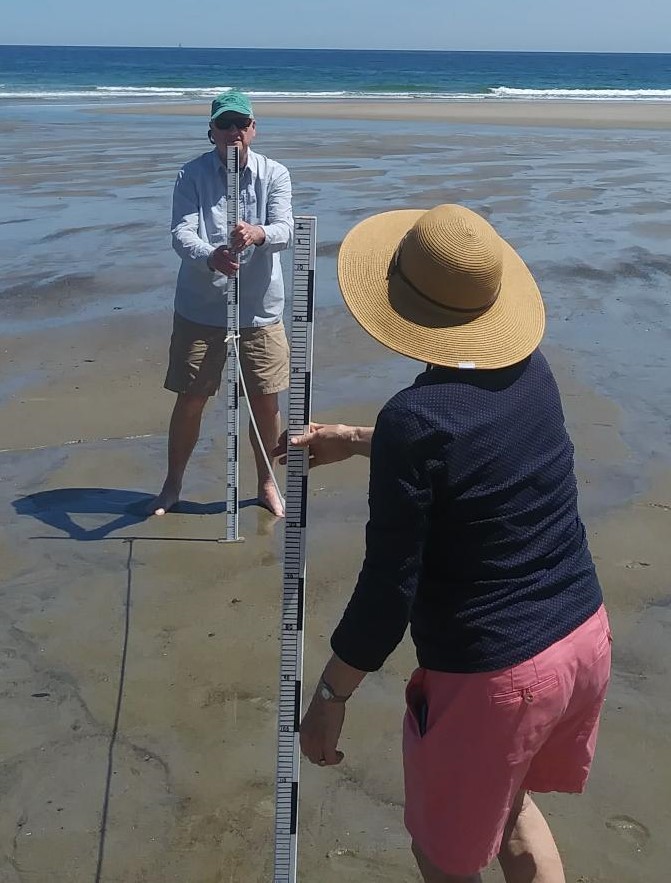 The Southern Maine Volunteer Beach Profile Monitoring Program collects beach sand erosion and accretion data using a simple profile measurement method every month. Dedicated volunteers perform the beach measurements and submit the data to the Maine Geological Survey for analysis. From 1999-2026 the Southern Maine Volunteer Beach Profile Monitoring Program was a partnership with University of Maine Cooperative Extension - Maine Sea Grant.
The program is a unique collaboration among local volunteers, participating municipalities, and scientists, resulting in over 25 years of critical data on the status of one of Maine’s most vital and valuable natural resources. Read more about the program.
Volunteer Data Entry
Current program volunteers should use one of the following datasheets to enter profile data. Using one of the Excel sheets is recommended but if you don't have the Microsoft Excel software use the fillable PDF form. Instructions for using the datasheets and the submission procedures are linked below for each file type. It is a good idea to download the forms from the links below each month you enter data. This will guarantee that you always get the most recent version of the datasheet files.
- Maine Beach Profiling Datasheet:
| Excel (version 1.5 [xlsx]) | Instructions |
| Excel with macros (version 1.5 [xlsm]) | Instructions |
| PDF Form (version 1.0) | Instructions |
Completed datasheets should be emailed to christian.h.halsted@maine.gov for uploading into the database and website.
See the suggested profile schedule to plan your profiling.
Beach Profile Graph
If you would like to explore the data collected by the Maine Beach Profiling volunteers, you can use the graphing and data table resources below.
Instructions for Graphing Beach Profile Data
- SELECT “STAKE” as the REFERENCE POINT
- SELECT a BEACH PROFILE STAKE: Click on the profile line box to view the list of available profile lines. Scroll down the list to find the profile line you’re seeking. If you don’t know the name of the profile line you’re seeking, a Naming Guide is provided below. Click on the profile line to select it.
- SELECT ONE or MORE DATES to GRAPH: Once you’ve selected your profile line, there will be a brief pause, and then all the available dates for that line will be displayed in the box. Scroll through the list to dates to select the date you’d like to graph. If you’d like to graph more than one date, click on your first selected date, then right-click (PC) or shift-click (Mac) to the last date in the series you’d like to graph. The system will graph all the dates in the series you’ve selected.
- VIEW the GRAPH: After the date(s) is selected, there will be another brief pause and then the graph for the profile line on the date(s) you’ve selected will be displayed below the date box.
How to Interpret a Beach Profile Graph
The Profile
The graph will show different dates select in different colors. The data points collected on the beach are all represented here by colored dots. Connecting these dots produces a profile line for each month.
The Measurements
Vertical Measurement (Stake (cm))
When looking at the graph, the vertical change in elevation from the beginning to the end of the profile line (from left to right on the graph) is measured in centimeters (the vertical line on the left). The “Stake” is the marker on the beach that indicates the start of the profile line. Profiles are generally lower at right side of the graph compared to the left side, most of the centimeter measurements are going down, represented by negative (-) numbers, below zero. However, you will also see the profile line go up from the starting point, in which case, the measurements are represented by positive (+) numbers.
Horizontal Distance (M)
The horizontal distance from the beginning (at the Stake) to the end of the profile line is measured in meters (the line that runs on the bottom of the graph). Typically, each data point consists of a 3-meter measurement, though this may vary among different profiles and beaches.
A Note on Units
Because the graph’s measurement units (cm and M) are not the same, the resulting slope is exaggerated making the profile lines look more like ski slopes, than gently sloping beaches. But this graphic approach is necessary in order to be able to view the data on a standard sized page.
The Result
To read the graph, look at the lines in relation to each other. A graph with a profile line higher than another indicates a gain in the volume of sand.
The Method
Please note: The data used to generate graphs is collected by trained volunteers using a relatively simple method for obtaining beach profile shapes and its quality is checked by program staff. However, this method has some inherent inaccuracies, including but not limited to:
- dependence on an accurate starting point;
- the visibility of the horizon during a survey;
- horizontal or vertical measurement errors made during data collection;
- data recording errors;
- and beach conditions on the day of the survey, amongst others.
The Interpretation
Comparing different dates at the same beach profile location can provide a good, qualitative, indication of horizontal and vertical changes of the beach or dune observed at that particular beach profile over time. However, data viewers should note:
- a recorded beach profile only represents the shape of the beach at the time of measurement (it is a snapshot);
- subsequent tides, currents, waves, or storms may change the shape of the beach dramatically from day-to-day;
- short-term (i.e., monthly) changes observed at a beach profile location do not necessarily represent a long-term (seasonal, annual, or decadal) trends;
- changes observed at a specific profile location do not necessarily represent overall changes at an entire beach;
- at a few locations the profile starting point has changed over time; this can lead to some graphs showing unusually large offsets of the profiles that do not represent beach erosion or accretion;
- recorded beach profile data should not be the only source of data used to determine beach management actions;
- and analysis or interpretation of beach profile data should be conducted by a professional.
The Fine Print
The graphs generated here represent snapshots of a particular profile at a particular time and do not represent long-term trends. Beach management decisions should be guided by a professional and not be based on this data alone.
Download Data
Maine Beach Profiling Data may also be downloaded directly from the Maine Geological Survey Open Data Portal. Two downloads are provided. For general purpose use, all approved data is provided in the Beach Profiling Data Export Table. To create profile graphs using the data, the Beach Profiling Graph Data Table. Both datasets are updated as soon as data from the beach profile teams is uploaded and approved by the Beach Profiling Volunteer Coordinator.
About the Program
What is Beach Profiling?
Beach profiling is a simple surveying technique used to measure changes in the contour of the monitored beach.
How it’s done:
Beach profiling measurements are conducted along profile transects. The profile transect is a straight line running from the crest of the dune or other high point on the beach (such as a seawall) to the waterline. Along the transect, measurements are taken every three meters allowing observations of the beach to be made. Each monitored beach has between two and seven profile transects. And each transect has a different number so that comparisons can be made between these various lines.
Watch the Introduction to Beach Profiling video from Maine Sea Grant.

Why it’s done:
Comparing profile lines recorded at different times makes it possible to measure changes in the distribution of sand on the beach. Tracking these changes over long periods (as we have done for over 20 years of the Southern Maine Beach Profile Monitoring Program) provides Maine Geological Survey with data to identify seasonal, annual, and even track long-term trends in beach erosion and accretion. This data is used to inform beach management decisions at the local and state level.
When and where it’s done:
Every month volunteers monitor the changes in sand movement along 12 beaches from York to South Portland.
The list of dates below is the recommended profiling schedule for volunteers. The times listed are the approximate low tides based on Kennebunkport, which is near the middle of all profiled beaches. Tide times will vary slightly by location. Profiling should begin 30 minutes to an hour before scheduled low tide. The dates selected are to best accommodate weekend daylight hours and tidal height. If these dates do not work best for the profiling team, schedule another date with a tide height <1.0ft. Ideal weekend dates are color-coded in green; rain dates are color-coded in light purple.
We Need Your Help!
The program is always in need of new volunteers. This is an opportunity to participate in a regionally significant volunteer monitoring effort, learn about coastal geology, meet like-minded community members, and spend some time at the beach! Beach profile monitoring occurs once a month, year round, at 12 beaches from York to South Portland. To learn more, contacts us at the email addresses below.
Contact Us
For program management or volunteer coordination contact:
Peter Slovinsky
Marine Geologist
peter.a.slovinsky@maine.gov
If you have any questions or problems using the tools on the site please contact:
Christian Halsted
Director, Earth Resources Information
christian.h.halsted@maine.gov