DACF Home → Bureaus & Programs → Maine Geological Survey → Maps, Publications and Online Data → Using Geologic Maps → Inner Continental Shelf Maps → Explanation
Explanation of Information Shown on Surficial Geology of the Maine Inner Continental Shelf Maps:
SURFICIAL GEOLOGY LEGEND
This map series shows the geology of the surface of the ocean floor. These maps of Maine's inner continental shelf are based on geophysical data, bottom samples, National Ocean Service provisional bathymetric maps and published nautical charts. These data were supplemented with bottom photographs and direct observations from submersibles. Experience with these data, together with side-scan sonar images (the underwater equivalent of aerial photographs), permitted generalized mapping of the inner continental shelf.
The map areas shown by the four colors below were not directly imaged with side-scan sonar. Contacts between these geologic units were inferred, based on bathymetry and other information (see Features and Data Source Map - Figure 6).
The bright colors on the map and in the Interpretation of Side-Scan Sonar Images legend below show areas of seafloor imaged by sonar. The linear colored swaths on the maps follow ship tracklines and have a width that represents the sonar swath to each side of the vessel.
 |
ROCKY - Rugged, high-relief seafloor is dominated by bedrock outcrops (ledge) and is the most common type on the Maine inner continental shelf, especially in depths of less than 60 m (~200 ft). Accumulations of coarse-grained sediment occur in low-lying areas and at the base of rock outcrops. |
 |
GRAVELLY -Generally flat-lying areas are covered by coarse-grained sediment, with clasts up to several meters (yards) in diameter. In some areas gravel and boulders directly overlie bedrock. These deposits are not presently accumulating on the shelf but represent Pleistocene (Ice Age) material. Ripples are common in well-sorted gravel, indicating that some of the older glacial sediments are presently being reworked by waves, currents, and tides. |
 |
SANDY - Generally smooth seafloor consists primarily of sand-sized particles derived from rivers, reworked glacial deposits and/or biogenic shell production. This bottom type, although well represented in southwestern areas, is the least common on the Maine inner continental shelf. |
 |
MUDDY - Deposits of fine-grained material form a generally flat and smooth seabed commonly found in sheltered bays and estuaries and at depths of greater than 60 m (~200 ft). In some submarine valleys the mud may be meters (yards) thick. Deep depressions (gas-escape pockmarks) occur in some muddy bays. |
INTERPRETATION OF SIDE-SCAN SONAR IMAGES
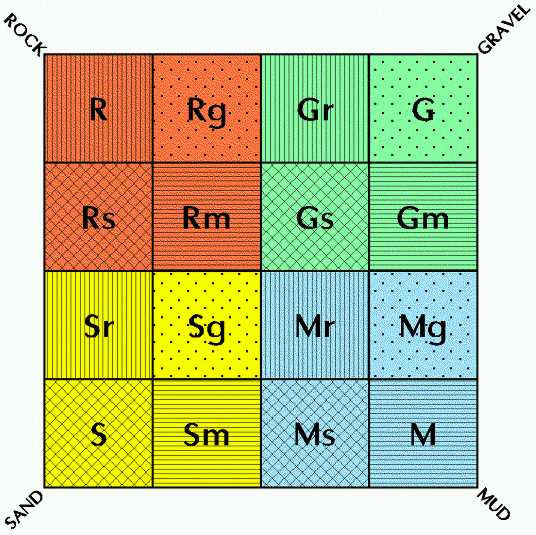 Figure 1. On side-scan sonar images, rock, gravel, sand, and mud reflect acoustic energy differently and appear as various shades of gray printed by the instrument's recorder. The classification scheme above is unique and based on the acoustic reflectivity of the Maine inner continental shelf. The dominant "end member" (Rock, Gravel, Sand, or Mud) is abbreviated with a capitalized first letter. A less abundant, subordinate seafloor type is represented with a lower case letter (r, g, s, or m). For example, a predominantly rocky seabed with gravel infilling fractures is designated Rg. The sixteen combinations of seafloor types shown above are used for areas where side-scan sonar coverage exists and appear as bright colors on the map. |
On side-scan sonar images, rock, gravel, sand, and mud reflect acoustic energy differently and appear as various shades of gray printed by the instrument's recorder. The classification scheme above is unique and based on the acoustic reflectivity of the Maine inner continental shelf. The dominant "end member" (Rock, Gravel, Sand, or Mud) is abbreviated with a capitalized first letter. A less abundant, subordinate seafloor type is represented with a lower case letter (r, g, s, or m). For example, a predominantly rocky seabed with gravel infilling fractures is designated Rg. The sixteen combinations of seafloor types shown above are used for areas where side-scan sonar coverage exists and appear as bright colors on the map. In areas beyond the scan range only four generalized units were used (see the Surficial Geology Legend and the Sidebar for details).
When individual units of rock, gravel, sand, and mud were greater than 10,000 square meters in area (about the size of 3 football fields), they were mapped as separate features. In many places, however, a heterogeneous seabed composed of numerous small features required composite map units. In areas where no single seafloor type exceeded 10,000 square meters, a composite map unit was used. The selection of map units to describe this complexity involves a compromise between providing detailed information where it exists, and generalizing where data are scarce or absent. In many places the seabed is composed of numerous small features, none exceeding the minimum area of 10,000 square meters. Consequently, not all details in the sonar records could be presented on this map. It should be realized that spatial heterogeneity exists at all scales, even down to areas less than a square meter (ten square feet).
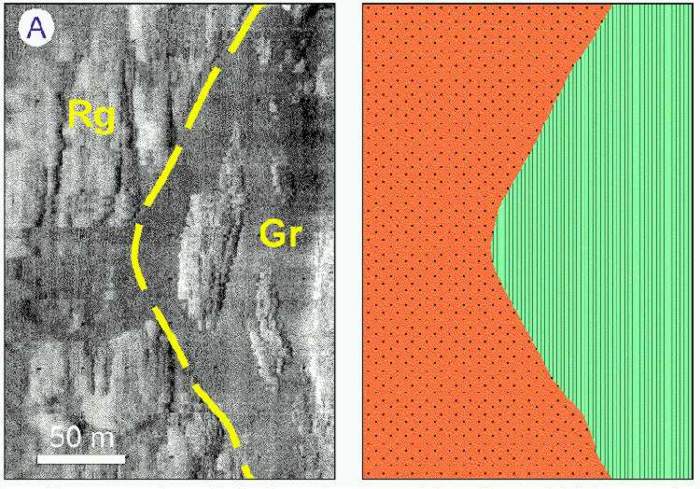
Figure 2. Side-scan sonar image (left) of Rg and Gr areas of the seafloor and their interpretation (right). In the image, gravelly areas appear dark gray and bedrock outcrops show irregular perimeters, dark (soundreflective) streaks and light gray acoustic shadows. Fractures are prominent in the bedrock; gravelly areas have low relief.
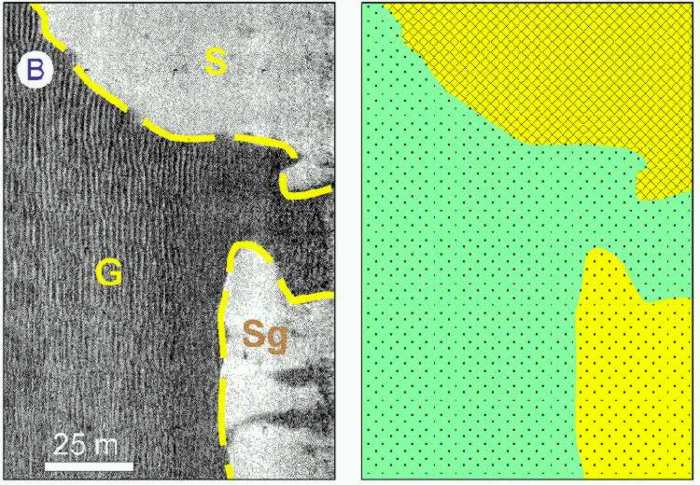
Figure 3. Side-scan sonar image (left) of S, Sg, and G areas of seabed and their interpretation (right). Sandy seafloor is lighter gray and appears smooth while the gravelly seafloor has wave ripples with straight crestlines about 1 m (3 ft) apart. Sg areas occur as a patchwork of S and G types, but are too small to discriminate at this map scale.
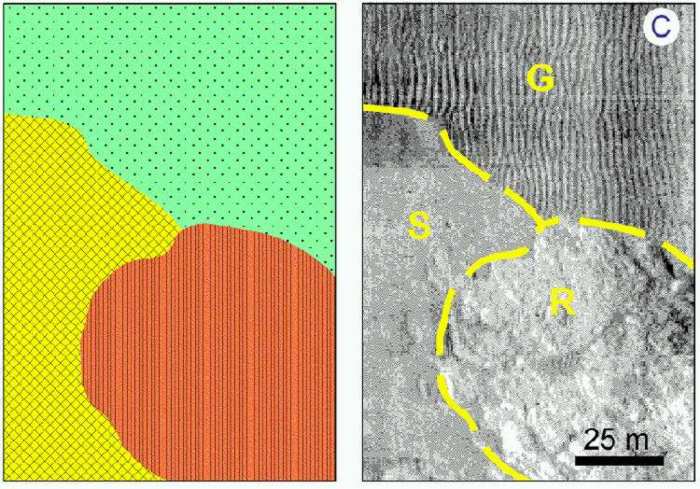
Figure 4. Side-scan sonar image (right) of S, G, and R with sharp boundaries and their interpretation (left). Ripples in the gravelly seabed produce alternating light and dark bands while the sandy surface is more uniformly gray. These ripples have a 2 m (6 ft) wavelength. The rocky outcrop rises above the surrounding seafloor.
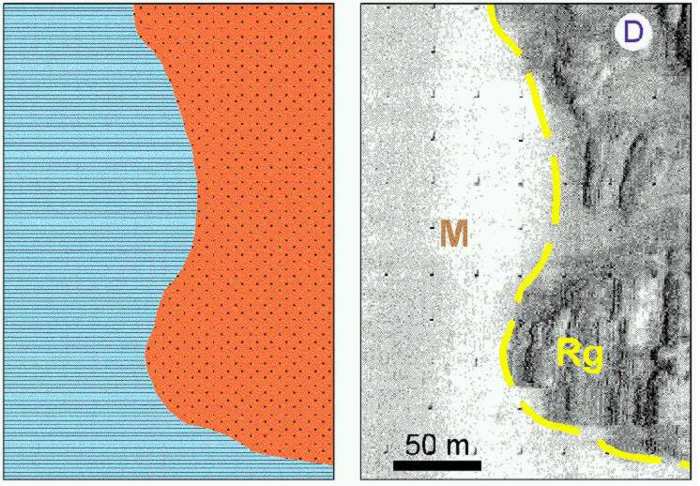
Figure 5. Side-scan sonar image (right) of M and Rg seafloor types and their interpretation (left). Muddy seafloor is uniformly light gray although the tonal difference on the left edge is a recorder artifact. A mixture of rocky outcrops has an irregular dark gray appearance while gravelly troughs appear smooth and dark gray.
Rock yields a strong, dark, acoustic return. In areas with steep bathymetric relief and fractures, light acoustic shadows are visible within the dark areas of rock (see adjacent panels A, C, and D). Gravel deposits also produce a relatively strong acoustic return (black to dark gray), and are often closely associated with rock, but lack relief (A, B, C, D). Sand produces a much weaker acoustic return (light to dark gray) than either gravel or rock, and usually lacks local relief (B). Mud yields a very weak surface return (light gray to white) and, except where it accumulates on steep slopes or near gas-escape pockmarks, it is associated with a smooth seabed (D). The Surficial Geology section in the far right column describes the distribution and abundance of these areas on Maine's inner continental shelf.
FEATURES AND DATA SOURCES
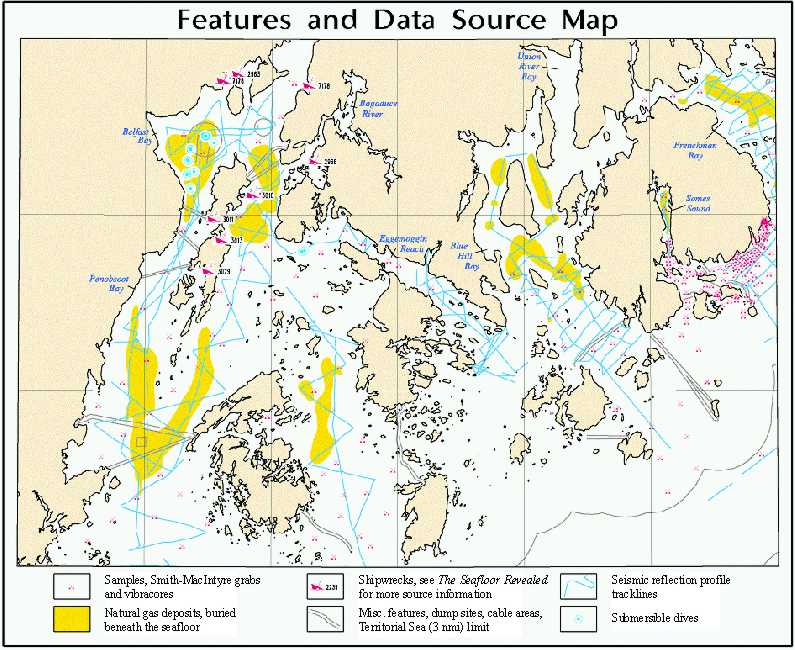 Figure 6 |
Last updated on April 25, 2012