DACF Home → Bureaus & Programs → Maine Geological Survey → Hazards → Maine Sea Level Rise Ticker → FAQ
Sea Level Rise/Storm Surge - Frequently Asked Questions
- Q1. What is the Maine Sea Level Rise Ticker and what does it show?
- Q2. How do I use the Ticker?
- Q3. What is shown on the Sea Level Rise Dashboard?
- Q4. Where does the data for the Ticker and Dashboard come from?
- Q5. When are the data for the Ticker and Dashboard updated?
- Q6. What are the limitations of data provided by the Ticker and Dashboard?
What is the Maine Sea Level Rise Ticker and what does it show? Back
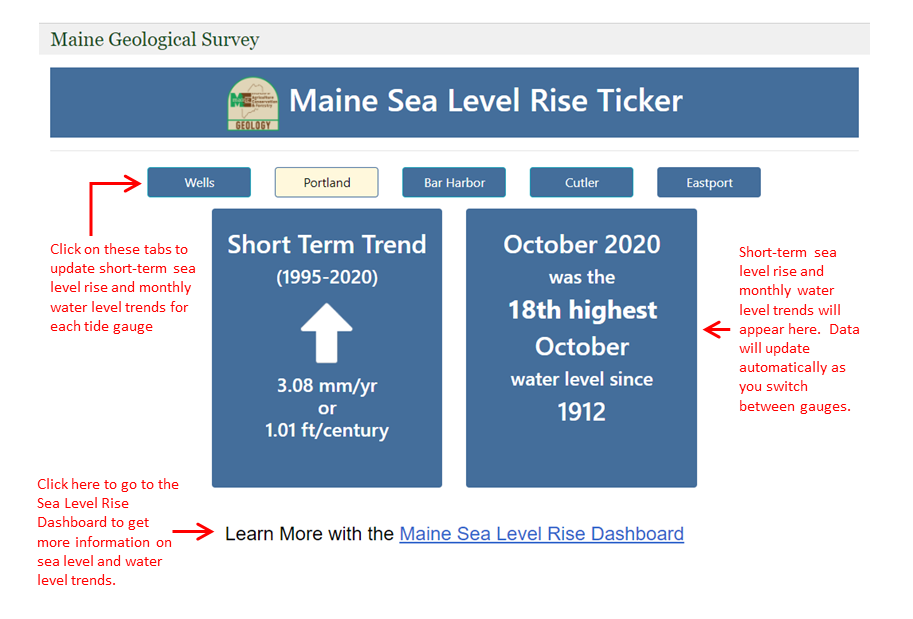
Maine’s new sea level rise “ticker” displays quick, easy to read information on short-term (1993-present, if data is available) sea level rise trends and ranking of monthly water levels for Maine’s five tide gauge stations (from southwest to northeast): Wells, Portland, Bar Harbor, Cutler and Eastport. 1993 is used as the starting year in order to compare with global short-term trends from available satellite data compiled by the University of Colorado’s Sea Level Research Group. Short-term sea level rise data is calculated by using published verified NOAA average monthly values to calculate an annual average except for gauges (e.g., Wells) where only preliminary water levels are available; here, preliminary hourly data is used to calculate a monthly water level. A linear regression from the annual averages provides the rate of sea level rise. This allows for the calculation of a rate of sea level rise, in both millimeters per year (mm/yr) and feet per century (ft/century). The ticker also shows how the last month’s water level ranks in terms of all data from that month since the start of data collection.
How do I use the Ticker? Back
Simply click on the tide gauge of your choice to see updated short-term sea level rise trends and monthly water level rankings. Data will automatically update as you click between the different tide gauges. To learn more about sea level rise and water level data at each gauge, click the “Learn More with the Maine Sea Level Rise Dashboard” tab to be taken to the Maine Sea Level Rise Dashboard.
What is shown on the Sea Level Rise Dashboard? Back
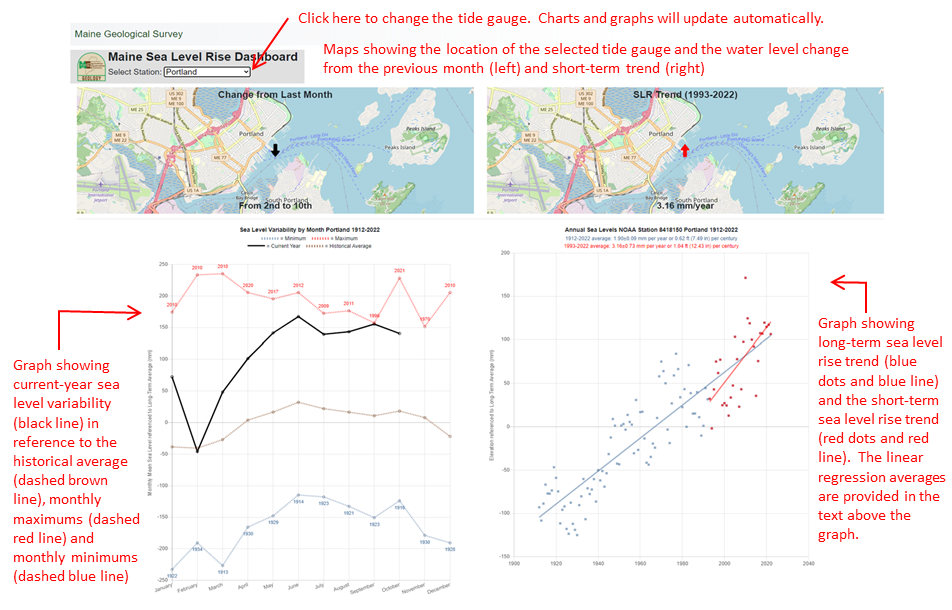
The Maine Sea Level Rise Dashboard includes more in-depth information about sea level and water level trends at each of Maine’s tide gauges, including a variety of charts and graphs. The Dashboard is arranged so that users can view locations of gauges in map format (top row), along with supporting graphs and written text (second through sixth rows) – the graphs in the second row provide supporting information to the maps in the first row. Users can select a different tide gauge from the “Select Station” query box to view information for each gauge, including:
- Row 1 – maps that show the approximate location of the selected tide gauge and display water level changes from the last month (e.g., from September to October), and short-term sea level rise trends (in mm/year).
- Row 2 – graph (left) showing sea level variability (by month, with the current year plotted in black, maximum values plotted in red, minimum values in blue, and average values in brown) and graph (right) showing short-and long-term sea level rise trends (short-term plotted in red, long-term in blue).
The graphs are arranged to provide supporting information for the maps in row 1.
Examples of maps and graphs from rows 1 and 2 are shown below for the Portland tide gauge.
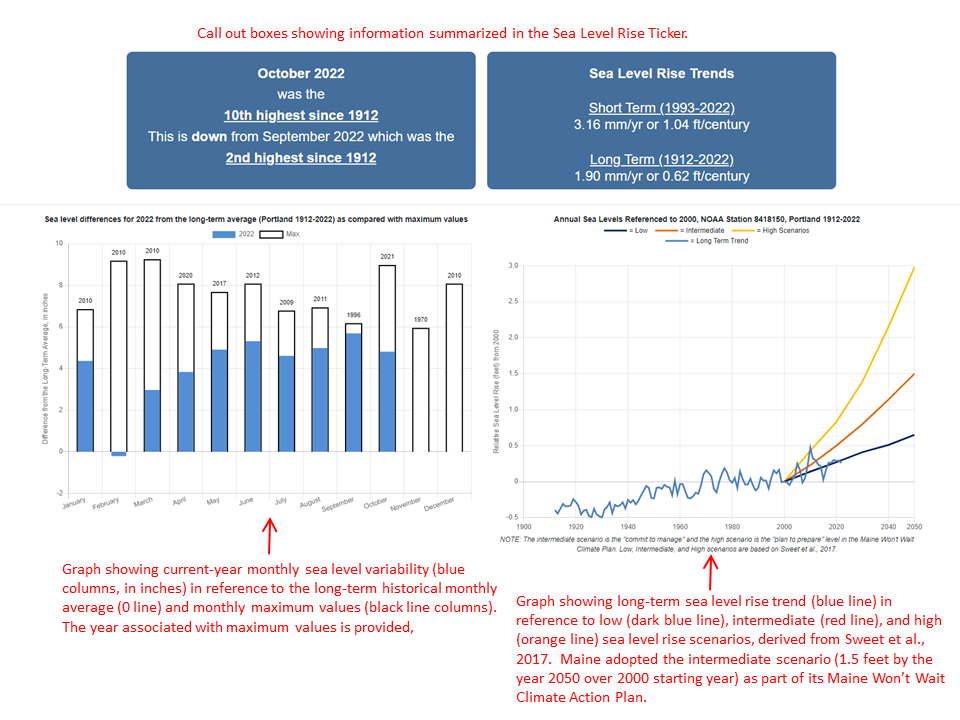
- Row 3 – summary information (in call-out box format) on monthly water levels and sea level rise trends (similar to what is provided by the Ticker).
- Row 4 – graph (left) showing the current year monthly sea level variability (in inches, blue columns) in reference to the long-term monthly average (0 line) and maximum monthly values (black line columns). Graph (right) showing long-term sea level rise trend (blue line) in reference to low (dark blue line), intermediate (red line), and high (orange line) sea level rise scenarios.
Examples of information provided in rows 3 and 4 are shown below for the Portland tide gauge.
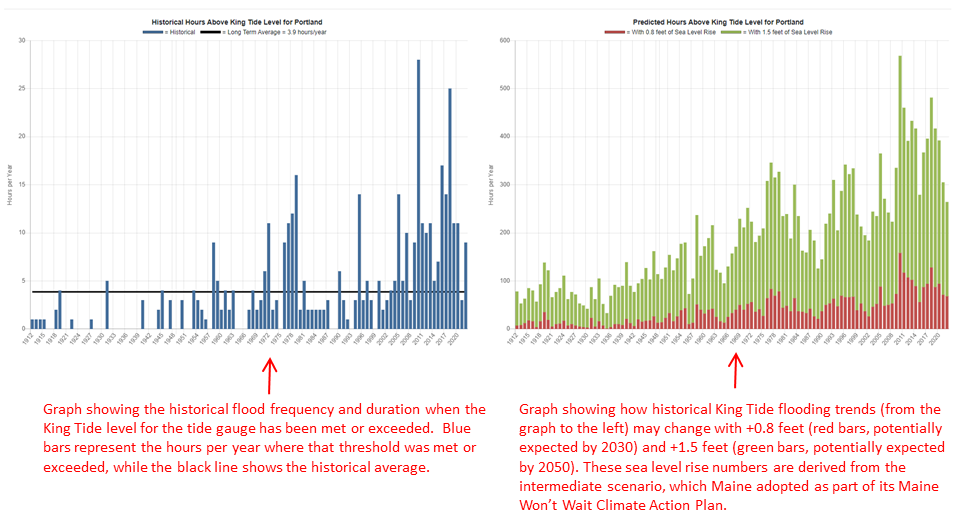
- Row 5 – graph (left) showing the historical hours of flooding when water levels are at least within 5% of the “King Tide” or Highest Astronomical Tide level for each tide gauge. Flooding near the King Tide level is an indication of the duration of nuisance or storm flooding of low-lying areas. The blue bars in the left graph show the hours per year where the King Tide level flood threshold was met or exceeded, while the black line shows the historical average. The right graph shows how sea level rise of +0.8 feet (red bars) and +1.5 feet (green bars) would increase the hours of inundation over historical numbers. Note that the vertical axes for historical and predicted hours of inundation are different scales. Sea level rise of +0.8 and +1.5 feet (over 2000 levels) relate to 2030 and 2050 projections associated with Intermediate sea level rise scenario from the Maine Climate Council Scientific and Technical Subcommittee’s Scientific Assessment of Climate Change and Its Effects in Maine (PDF 36MB). Much more background on sea level rise and coastal flooding is available in the February 2020 Scientific Assessment.
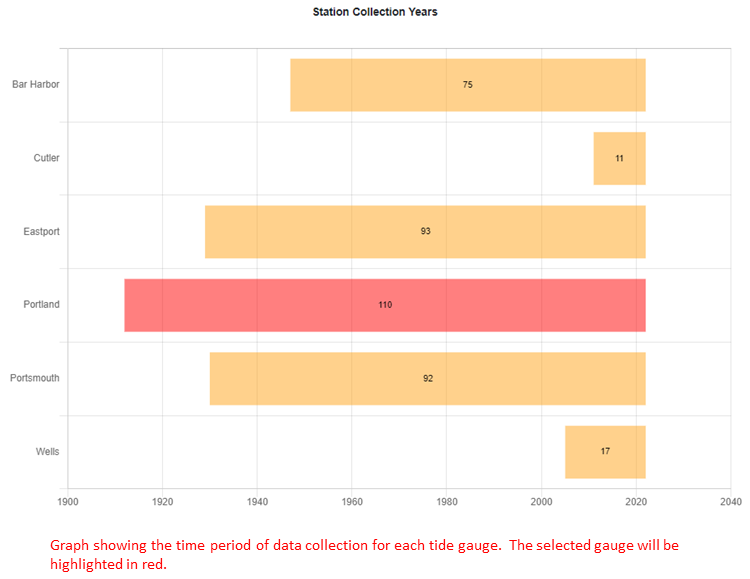
- Row 6 – graph showing period of data collection for each tide gauge with the selected gauge highlighted in red.
Examples of information provided in rows 5 and 6 are shown below for the Portland tide gauge.
Where does the data for the Ticker and Dashboard come from? Back
Data supporting the ticker and dashboard are calculated and updated monthly by the Maine Geological Survey as water level information is updated at NOAA’s Center for Operational Oceanographic Products and Services (CO-OPS). CO-OPS maintains the tide gauges and releases updated and verified water level data around the middle of each month for the previous month. CO-OPS also provides sea level rise trends from around the world that are updated on an annual basis.
When are the data for the Ticker and Dashboard updated? Back
Usually the Maine Geological Survey will update these web pages within a few days of the release of new CO-OPS monthly data. So, check back after the middle of the month for the latest trends and newest rates of sea level rise along the Maine coast.
What are the limitations of data provided by the Ticker and Dashboard? Back
In general, it is recommended that sea level trends be determined using water level data that covers at least a 19-year period – this is long enough to generally account for all of the factors that influence tides. Three of Maine’s tide gauges – Portland, Bar Harbor and Eastport – meet this standard since data collection began in 1912, 1947, and 1929, respectively. Although both Wells and Cutler gauges do not meet this standard (data collection started in 2005 and 2010, respectively), we have chosen to provide visualizations of the data in order to provide the most up-to-date information possible and to have a means of showing monthly updates.
Also, please note that the tide gauge in Cutler was moved in 2010 from a previous location (at Cutler Naval Station) to Cutler Farris Wharf (current location). Long-term sea level rise trends (2.34 mm/year from 1979-2010) for the previous location is available from NOAA’s CO-OPS.
Last updated on February 13, 2023