DACF Home → Bureaus & Programs → Maine Geological Survey → Hazards → Sea Level Rise/Storm Surge → FAQ
Sea Level Rise/Storm Surge - Frequently Asked Questions
- Q1. What is the Highest Astronomical Tide?
- Q2. How is the Highest Astronomical Tide calculated?
- Q3. What data is visualized in this viewer?
- Q4. Can these data be used to visualize storm surge and sea level rise together?
- Q5. Where did the sea level rise scenarios come from?
- Q6. How are the sea level rise/storm surge layers created?
- Q7. Why are sea level rise and storm surge scenarios projected on top of the Highest Astronomical Tide instead of another water elevation?
- Q8. Why are certain areas of the coast shown as being potentially flooded when they look to be disconnected from the ocean?
- Q9. What are the main causes of sea level rise on a global scale?
- Q10. How do we know that sea levels are changing in Maine?
- Q11. Do ocean water levels in Maine vary by season?
- Q12. What are storm surge and storm tide and what’s the difference?
- Q13. How large have storm surges been in Portland, Maine?
- Q14. How large have storm tides been in Portland, Maine?
- Q15. Do the sea level rise and storm surge scenarios include the impacts of waves?
- Q16. How do I print or download a map from the viewer?
Q1. What is the Highest Astronomical Tide? Back
According to NOAA, the Highest Astronomical Tide, is the elevation of the highest predicted astronomical tide expected to occur at a specific tide station over the National Tidal Datum Epoch, or NTDE. The NTDE is a specific 19-year period adopted by the National Ocean Service as the official time segment over which tide observations are taken and reduced to obtain mean values (e.g., mean lower low water, etc.) for tidal datums. It is necessary for standardization because of periodic and apparent secular trends in sea level. The present NTDE is 1983 through 2001 and is actively considered for revision every 20-25 years.
Q2. How is the Highest Astronomical Tide calculated? Back
Highest Astronomical Tide elevations along the Maine coastline were derived from two different sources: at select tidal stations, the elevation of the highest astronomical tide is a value from the NOAA COOPs Datums page. At other tidal prediction station locations, the Highest Astronomical Tide is estimated by using published tidal height differences and offsetting the Highest Astronomical Tide from reference tidal stations. These Highest Astronomical Tide water elevations were then adjusted (using VDATUM) to land elevations all along the coast, giving a continuous coast-wide representation of the landward limits of the Highest Astronomical Tide.
The Highest Astronomical Tide is also an important proxy for a regulatory boundary in Maine. The extent of the highest tides is included in Maine’s definition of the upper boundary of coastal wetlands through Maine’s Mandatory Shoreland Zoning Act.
Q3. What data is visualized in this viewer? Back
The Highest Astronomical Tide is visualized by a dark blue polygon, which shows the spatial extent of potential inundation during the Highest Astronomical Tide. In addition to the Highest Astronomical Tide, this viewer shows areas of potential future inundation along the Maine coastline on top of the Highest Astronomical Tide due to sea level rise or storm surge. Data can represent short-term coastal inundation caused by different storm surge scenarios that may coincide with the highest tide. Data can also be used to simulate future flooding during the highest tide after several different scenarios of sea level rise. The sea level rise scenarios included are 1.2, 1.6, 3.9, 6.1, 8.8 or 10.9 feet. These scenarios are visualized as increasing lighter shades of blue, green, and yellow. The viewer also shows red circles that provide important notes on areas of developed data.
Q4. Can these data be used to visualize storm surge and sea level rise together? Back
Yes, in a way. The inundation datasets allow users to map the extent of potential flooding from either storm surge, sea level rise, or a combination of the two. For example, the Highest Astronomical Tide plus 6.1 feet layer could be used to visualize the extent of flooding from 6.1 feet of storm surge, 6.1 feet of sea level rise, or a 3 foot surge event under a future scenario of 3 feet of sea level rise on top of the Highest Astronomical Tide. This allows consideration of a range of potential existing and future scenarios.
Q5. Where did the sea level rise scenarios come from? Back
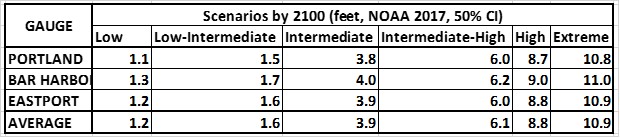
The sea level rise scenarios were developed by using available long-term sea level rise data from Portland, Bar Harbor, and Eastport tide gauges and the US Army Corps of Engineers Sea-Level Change Curve Calculator and sea level rise scenarios established by NOAA et al. (2017) prepared for the US National Climate Assessment. Scenarios were averaged for all three tide gauges and include low, intermediate low, intermediate, intermediate high, high, and extreme sea level rise at the 50% confidence interval, as shown below.
Q6. How are the sea level rise/storm surge layers created? Back
Data were created using what is called a “bathtub model”. This assumes that land surfaces stay static in response to rises in water. The “base” sea surface elevation was determined using the Highest Astronomical Tide and conversion of tidal elevations from a Mean Lower Low Water (MLLW) reference to North American Vertical Datum (NAVD88) along the Maine coastline using a tool called VDATUM. Tidal elevations were then interpolated along the shoreline and then overlaid onto the land surface represented by LiDAR, and areas of inundation (where water was higher than the land) were derived. For sea level rise and storm surge layers, selected scenarios were added to the base level, and the overall water level was then similarly overlaid onto LiDAR to identify inundated areas. More detailed descriptions of each step in this process can be found in the metadata included with each downloadable layer.
Q7. Why are sea level rise and storm surge scenarios projected on top of the Highest Astronomical Tide instead of another water elevation? Back
There are a few reasons why the Highest Astronomical Tide is a good starting point for visualizing future increases in sea level. The first is that the Highest Astronomical Tide along the Maine coastline can be between 2 and 3 feet higher than the mean higher high water (MHHW), which is a common starting point for sea level scenario mapping in other states and in web-based mapping tools. Using the Highest Astronomical Tide allows for visualizing the worst-case flooding scenario. Secondly, since the Highest Astronomical Tide approximates a regulatory boundary as part of Maine’s shoreland zoning, adding sea level rise scenarios to that elevation allows for communities to visualize how boundaries might change in the future.
Q8. Why are certain areas of the coast shown as being potentially flooded when they look to be disconnected from the ocean? Back
Many low-lying inland areas may appear cut off from the ocean but are actually tidally influenced via a culvert, storm drain, or other less apparent hydrologic connection. Certain other areas of the coast are part of more complex back-barrier wetland systems that have unclear tidal connections; such areas are typically behind dunes adjacent to beaches. Lastly, there are some coastal, fresh water ponds that have been engineered to block any incoming sea water and only allow one-way flow out of the ponds. Though these ponds may be low lying enough to flood under a given surge scenario they may not do so if the engineered flowage is maintained. In order to account for some of these areas, all of the inundation polygons have been classified to fit into one of four categories that describe the type of inundation represented in that area, including: 1) tidally connected area, 2) low-lying unconnected area, 3) freshwater pond/wetland; one-way flow, or 4) back-barrier wetland; unclear tidal connection. Low-lying unconnected areas are sections of the coast that may not be inundated under a given sea level rise scenario due to hydrologic restrictions. However, these areas are low lying enough to flood due to factors like storm overwash or a topographic change that allows for tidal influence (such as a breach of the dune system). Users may click on the map polygon to view the inundation classifications in the “NOTES” attribute field.
Q9. What are the main causes of sea level rise on a global scale? Back
There are two major forces driving global increases in sea level. The first is the thermal expansion of the world’s oceans due to increasing sea surface temperatures. As Earth’s atmosphere warms, it drives up temperatures in the global oceans. Because water naturally expands as it is heated, the actual volume of sea water increases as a result of warming temperatures, leading to an elevated sea level. The second driver of sea level rise is volumetric increase from fresh water inputs, mostly from the melting of land-based ice sheets (such as those in Greenland and Antarctica), and to a lesser extent, mountain glaciers. These two factors account for about 90% of observed sea level rise. Additional factors such as terrestrial water storage, vertical land movement, changes in ocean circulation, and gravitational driven changes account for the remaining 10% of observed sea level changes.
Q10. How do we know that sea levels are changing in Maine? Back
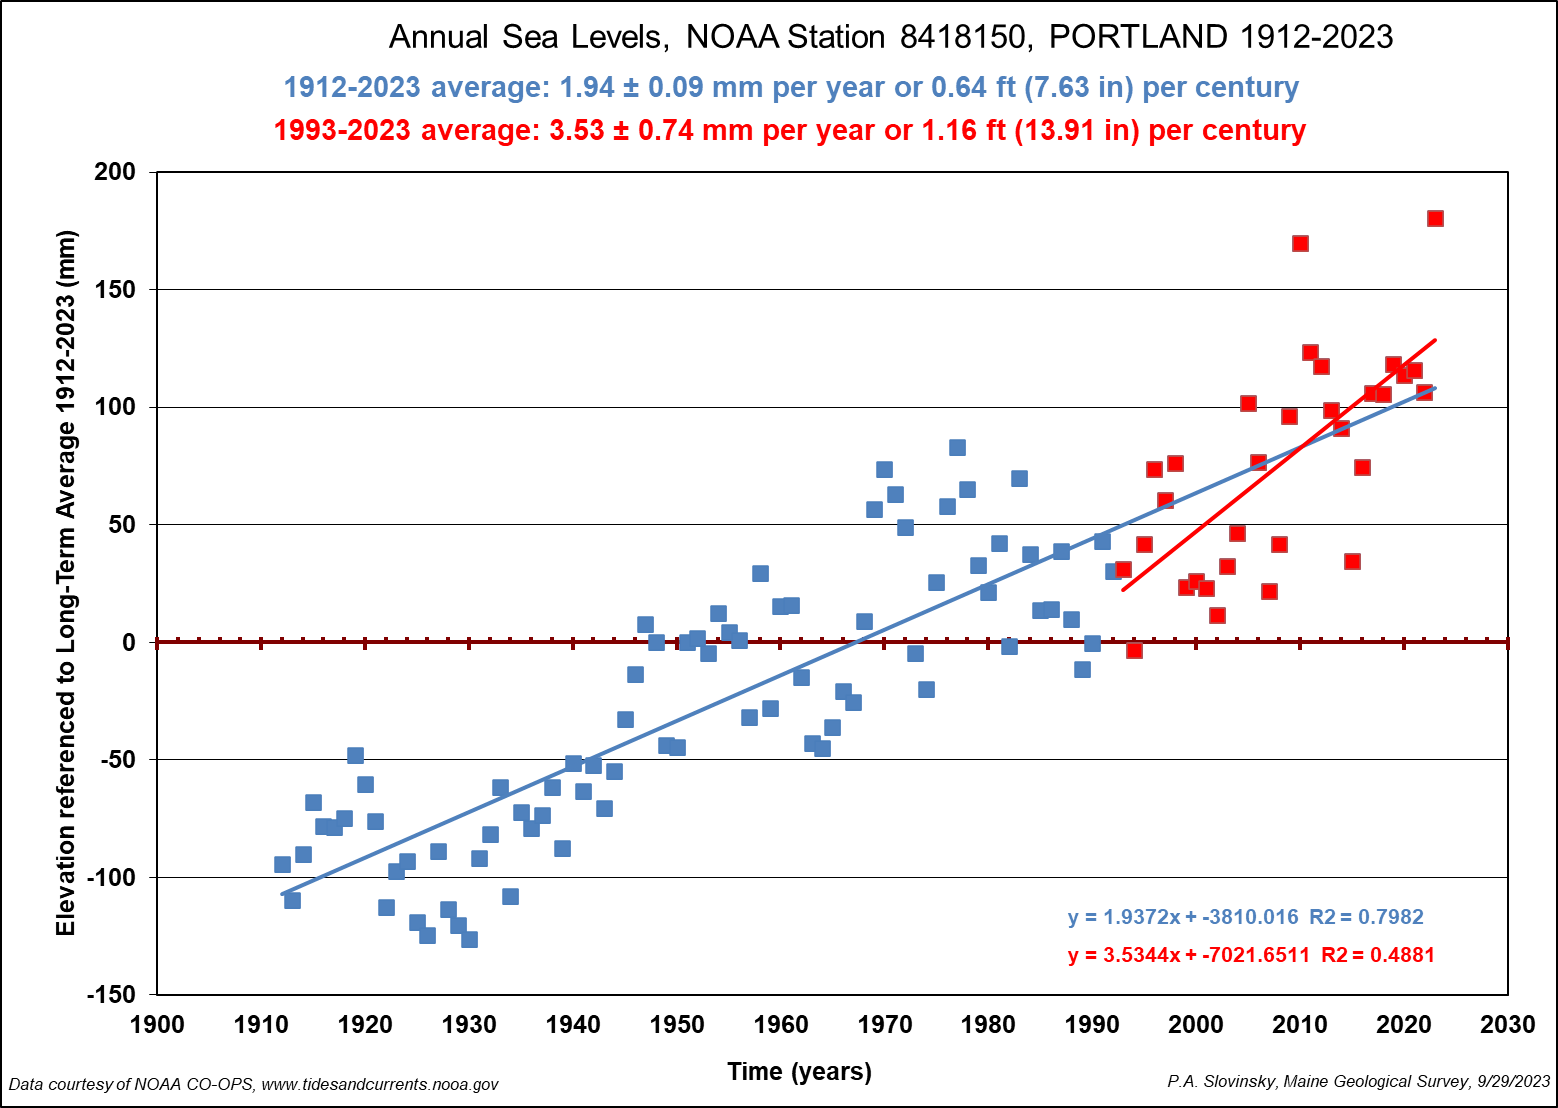
There are three tide gauges that record long-term changes in sea level on the coast of Maine. These are located at Portland, Bar Harbor, and Eastport. The earliest measurements began in Portland in 1912, while Eastport and Bar Harbor began in 1929 and 1947, respectively. Based on data from the Portland tide station (1912-2023) sea level has risen at a rate of 1.93 mm/yr or about 7.6” per century, as shown in the below figure. For reference, sea level has risen at the other long-term gauges at Bar Harbor and Eastport at 2.36 mm/yr and 2.28 mm/yr, respectively. These are all very close to global, long-term trends.
In the past 30 years (denoted by the red data in the graph below), the rate of sea level rise has increased. Although there is a lot of variability in the data (and as a result a lower r2 value), from 1993 to 2023, the trend in Portland has been about 3.53 mm/yr. Global sea level changes for the same time period have been at 3.5 mm/yr.
Q11. Do ocean water levels in Maine vary by season? Back
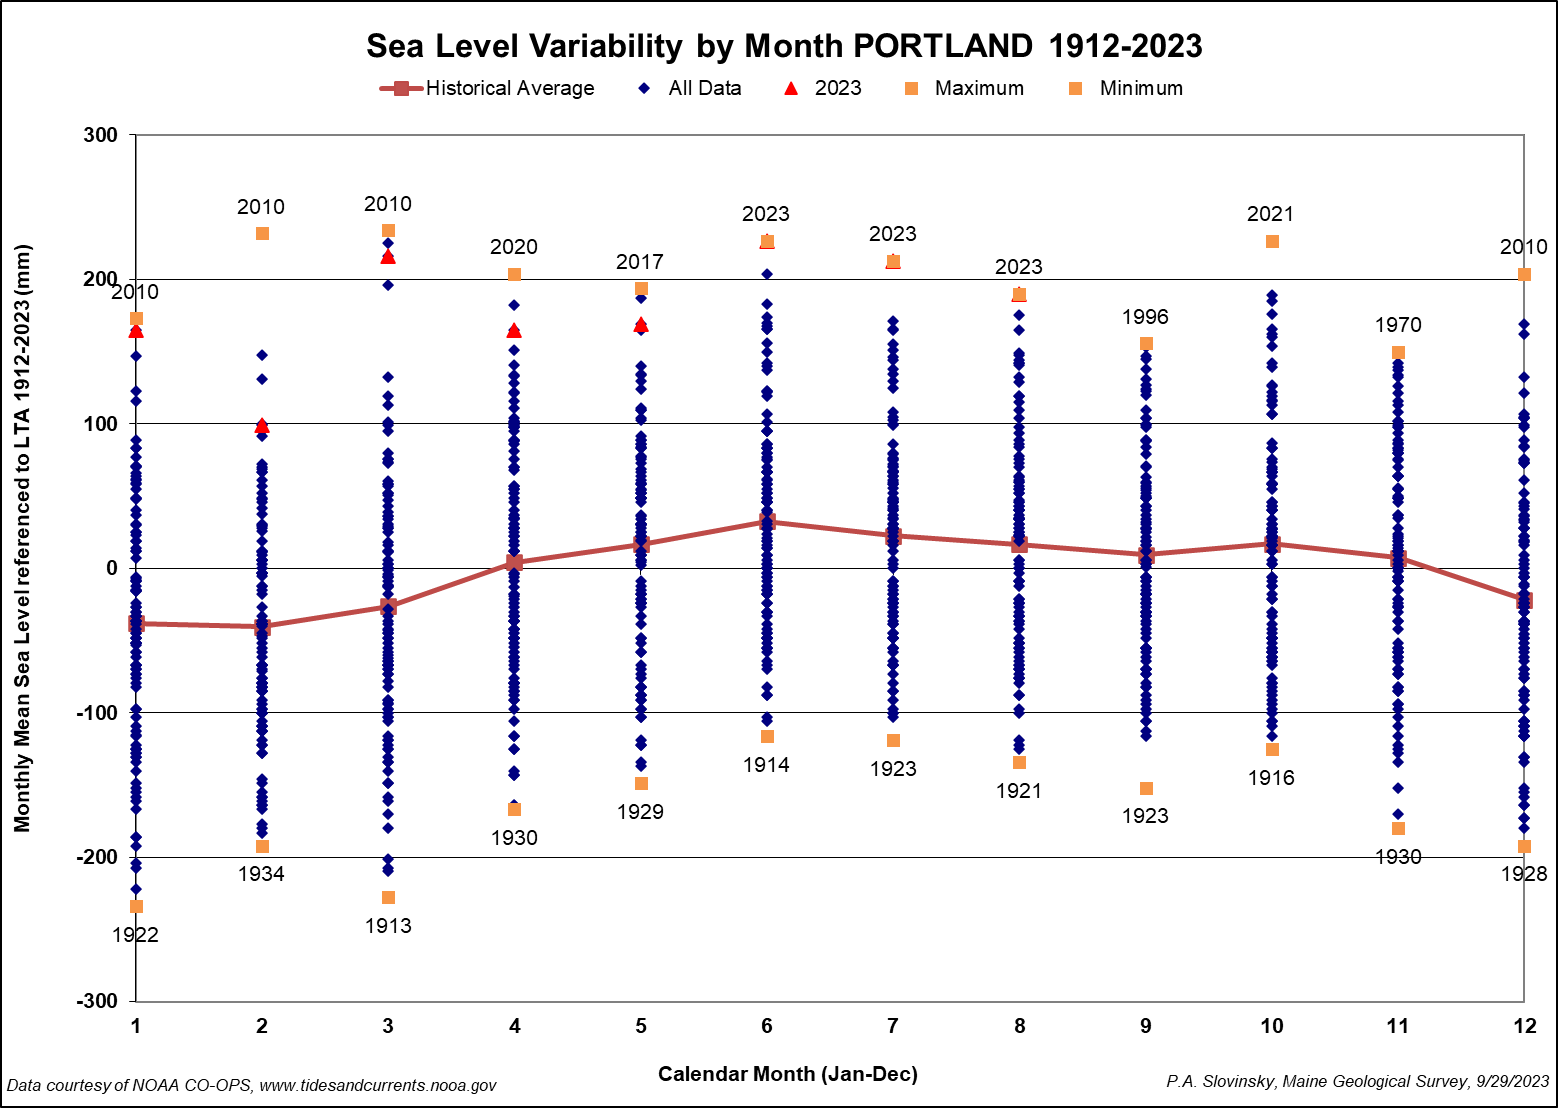
Yes. Typically, mean sea levels are higher in the summer months than the winter months along the Maine coastline, as shown in the figure below. This is due to the predominant weather patterns and wind directions. During the summer, southwesterly to southeasterly winds dominate, which actually blow water up against the Maine coastline, elevating water levels. Conversely, during the winter, the dominant wind directions are north to northwest, which blow water offshore, away from the coastline, thus lowering the average mean sea level. The below graph also shows the mean sea level values for each month (from each year), denoted as blue marks, in addition to the maximum and minimum values (and corresponding years) for each month, denoted as orange boxes. Finally, the graph also shows how water levels for each month from the current year are trending, shown as red triangles (for data through August 2023). As of August 2023, water levels in 2023 set records for June, July, and August at the Portland tide gauge.
Q12. What are storm surge and storm tide and what’s the difference? Back
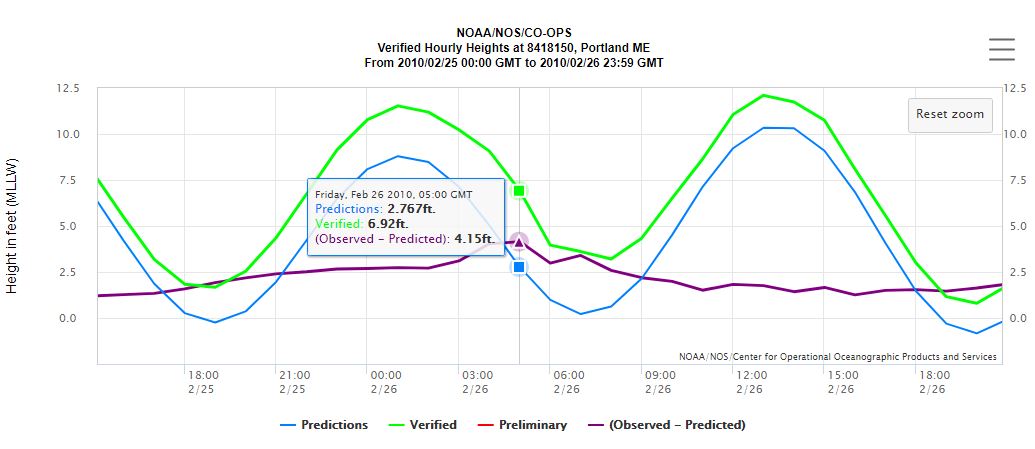
According to the National Hurricane Center, storm surge is an abnormal rise of water generated by a storm, over and above the predicted astronomical tides. Storm tide is defined as the water level rise due to the combination of storm surge and the predicted astronomical tide. As shown in the below figure, the predicted astronomical tide at Portland, ME during 2/25/2010 to 2/26/2010 is shown by the blue line. The observed water level – or the storm tide – is shown as the green line. The difference between the two – or the storm surge – is shown by the purple line. You can see in this example that the maximum storm surge of 4.15 feet hit at about 2 hours before low tide.
Q13. How large have storm surges been in Portland, Maine? Back
Based on statistical analysis of hourly data at Portland from 1912-2023, at any given tide, the recurrence intervals of storm surges are shown in the below table.
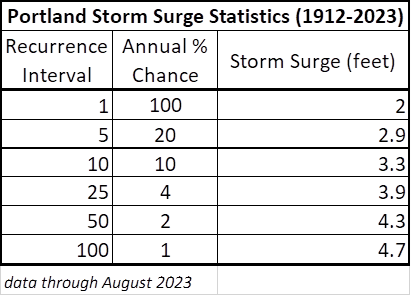
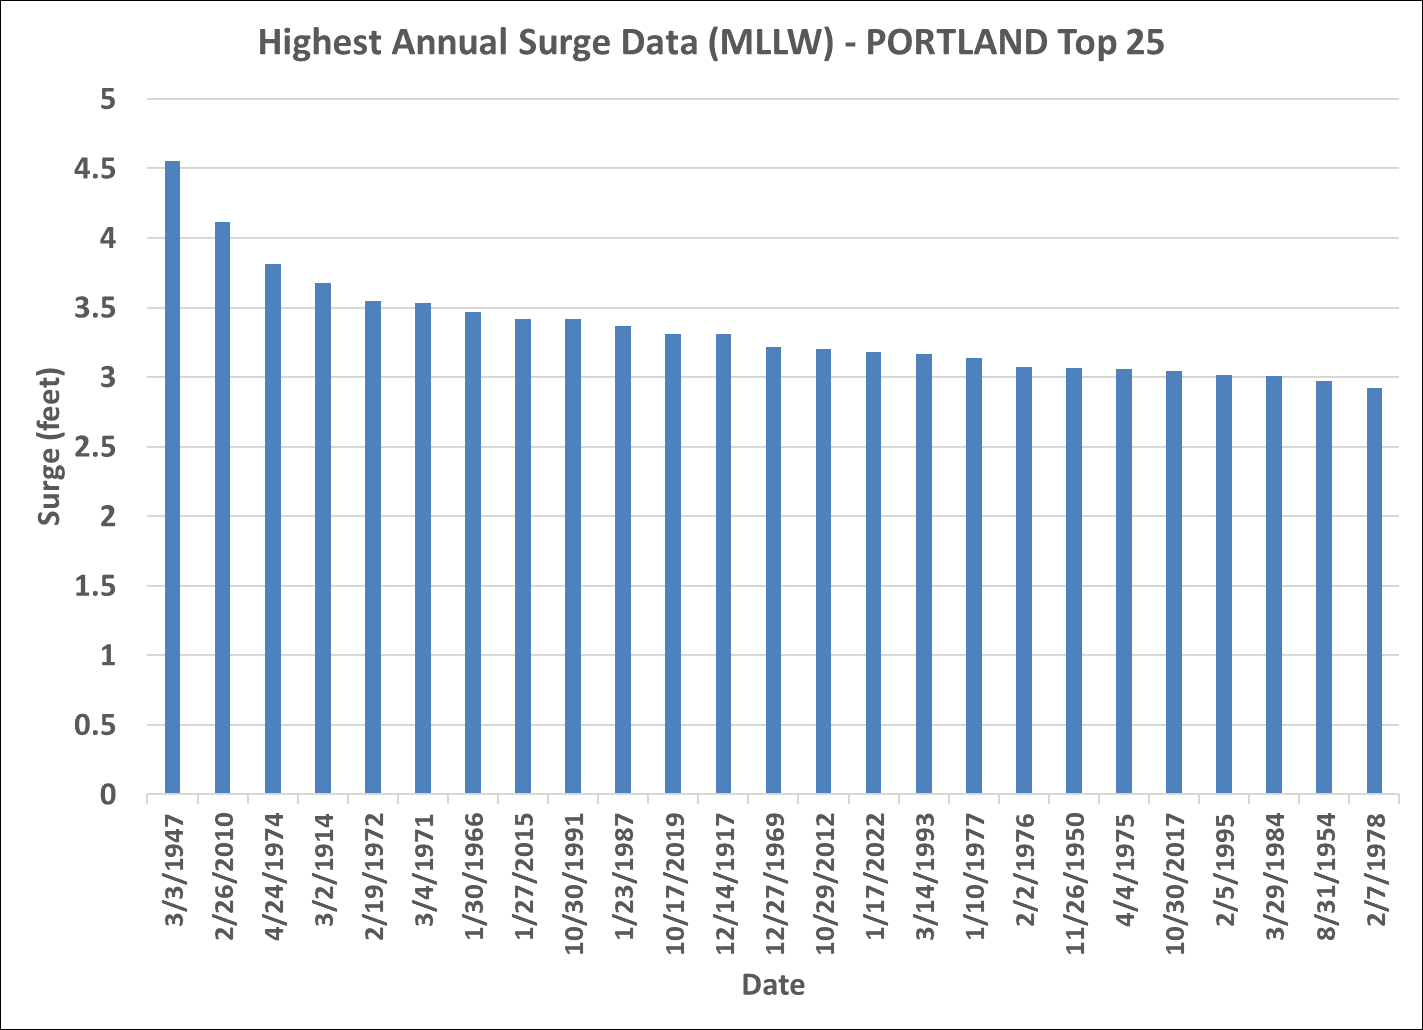
The annual event has a 1-year recurrence interval, which means it has a 100% chance of occurring in a given year, while the 100-year recurrence interval means it has a 1% chance of occurring in a given year. The top 25 highest measured annual storm surges (the highest surge of each year) are shown in the figure below. Note that these are annualized numbers, which are the highest number for each year. The highest measured surge was 4.61 feet on March 3, 1947. However, because this surge hit during a low incoming tide of around 3 feet MLLW it resulted in a very low overall storm tide. In general, it takes a big surge coinciding with an astronomically high tide to have significant flooding impacts along the Maine coastline.
Q14. How large have storm tides been in Portland, Maine? Back
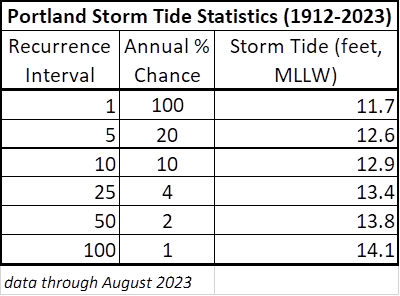
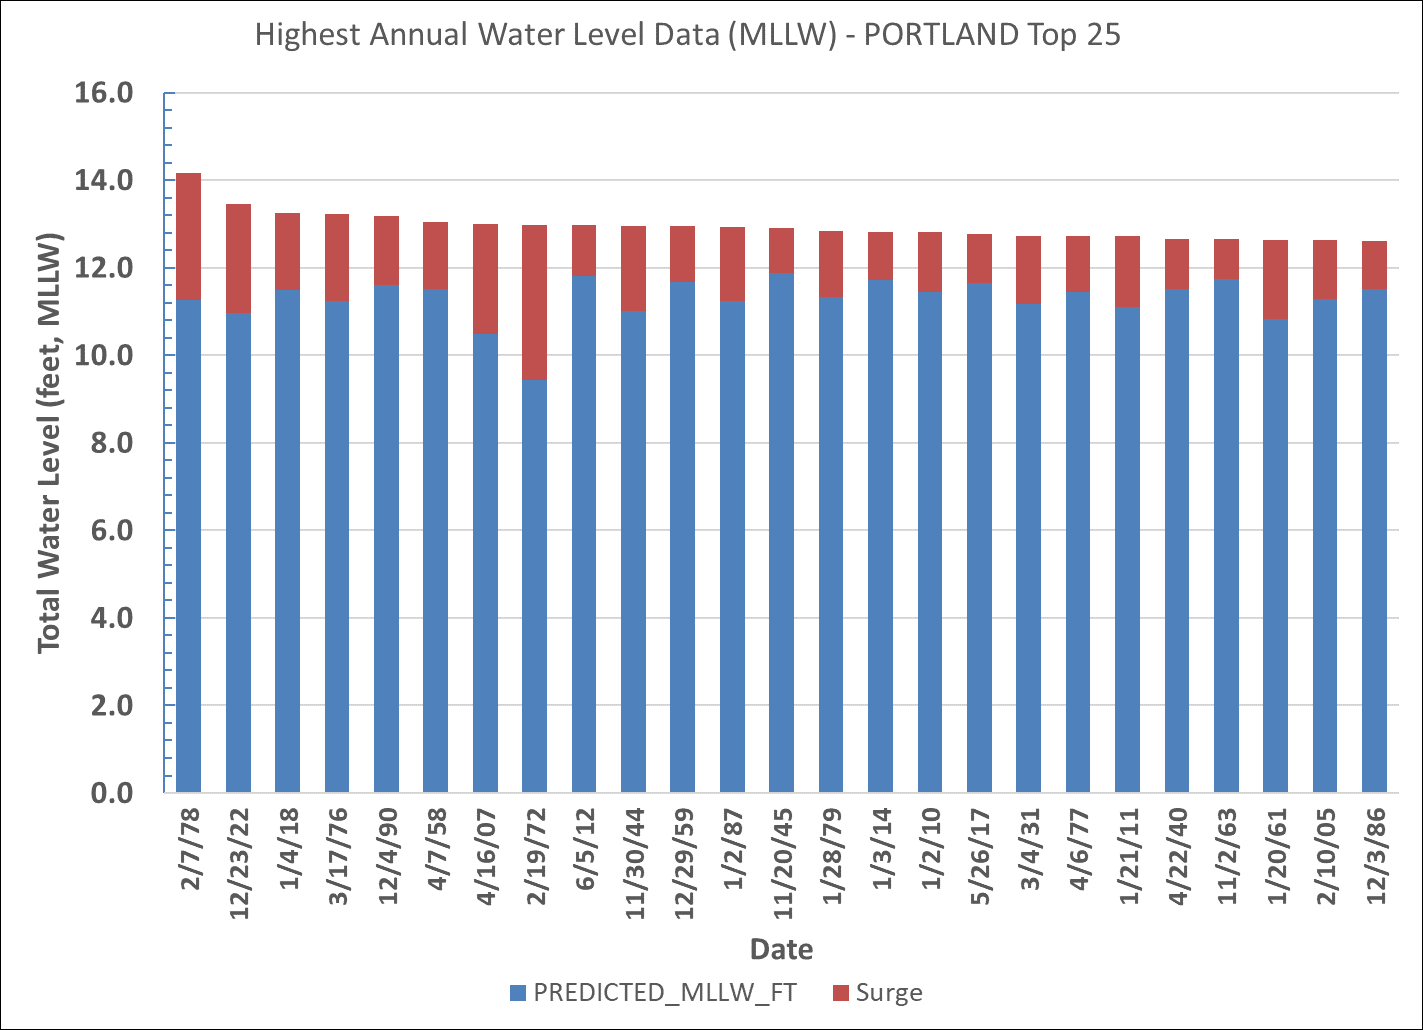
Based on statistical analysis of hourly data at Portland from 1912-2023, the recurrence intervals of storm tides are as shown in the below table. The predicted tide component of the overall storm tide is shown in blue, while the storm surge component is shown in red.
The highest annual storm tide was from the February 1978 storm, which had an astronomical tide of 11.27 feet MLLW and a storm surge of 2.89 feet, resulting in an overall storm tide of 14.1 feet MLLW. This actually exceeded the statistical 1% event. The second highest annualized storm tide – 13.45 feet MLLW – occurred as a result of the December 23, 2022 storm. Note again that these are annualized numbers, which are the highest number for each year. The top 25 measured annual storm tides are shown below.
Q15. Do the sea level rise and storm surge scenarios include the impacts of waves? Back
No. The scenarios provided simply display the potential flooding from the temporary increase in still-water sea level, and therefore do not include the potential impacts of waves. Wave run-up predictions are extremely complex and require a higher order of modelling than is used for these analyses. Users should keep in mind that waves can contribute significantly to the inundation extent during storm events and are one of the greatest contributors to storm-related structural damage.
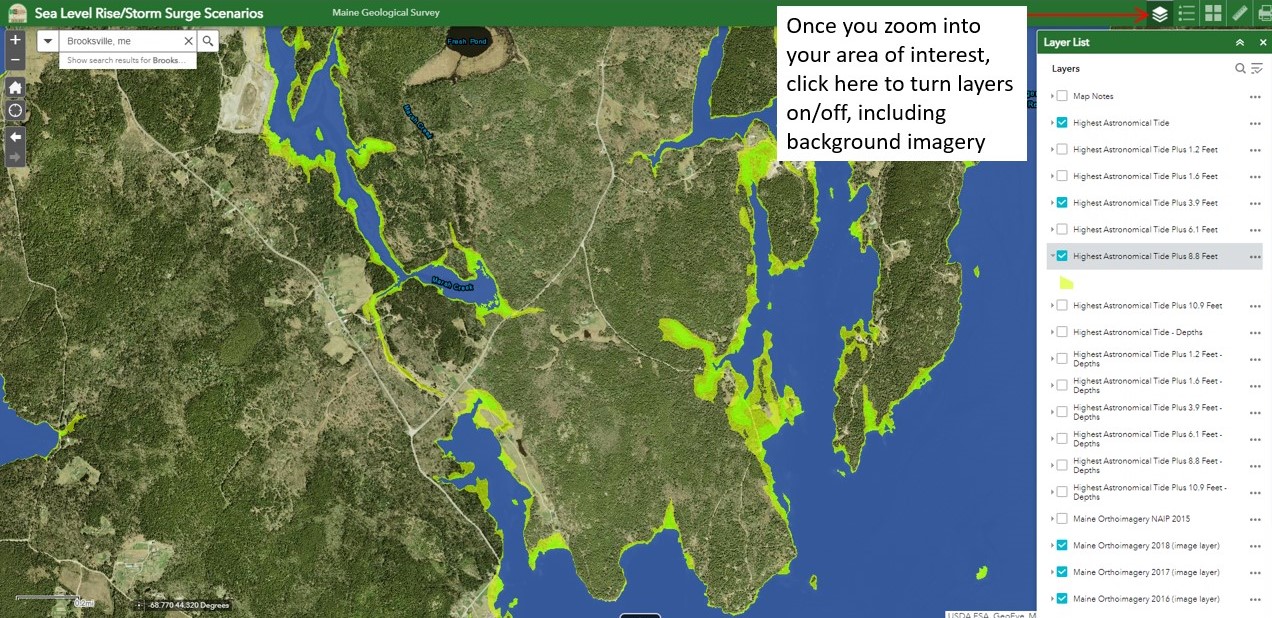
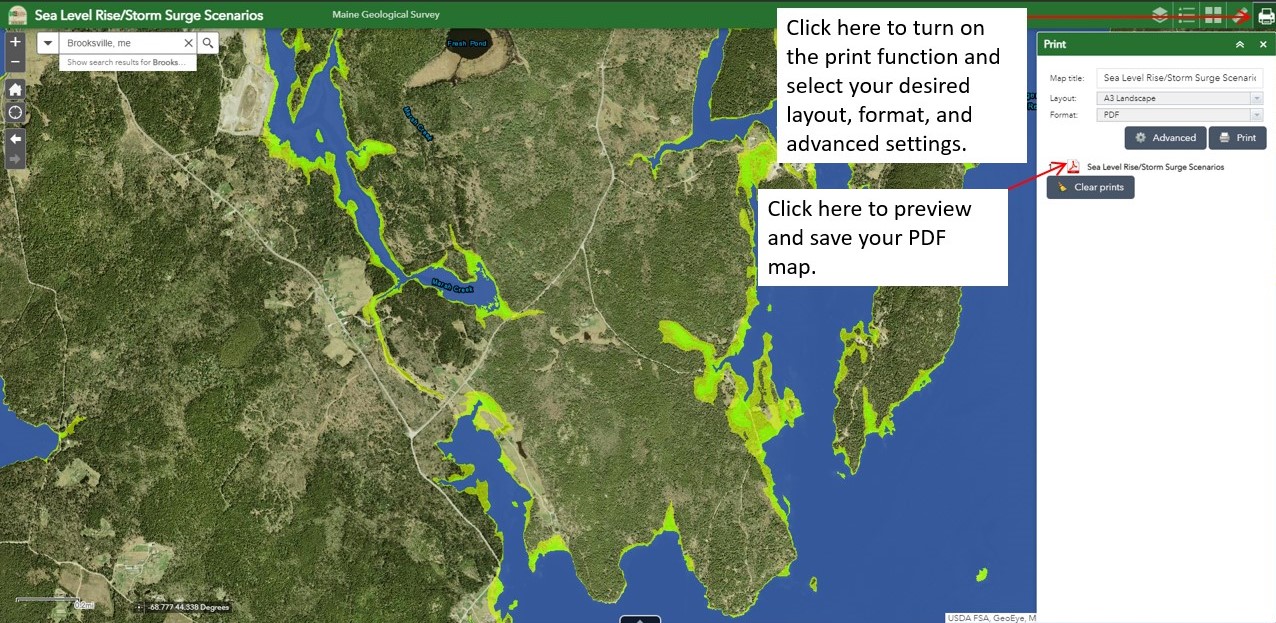
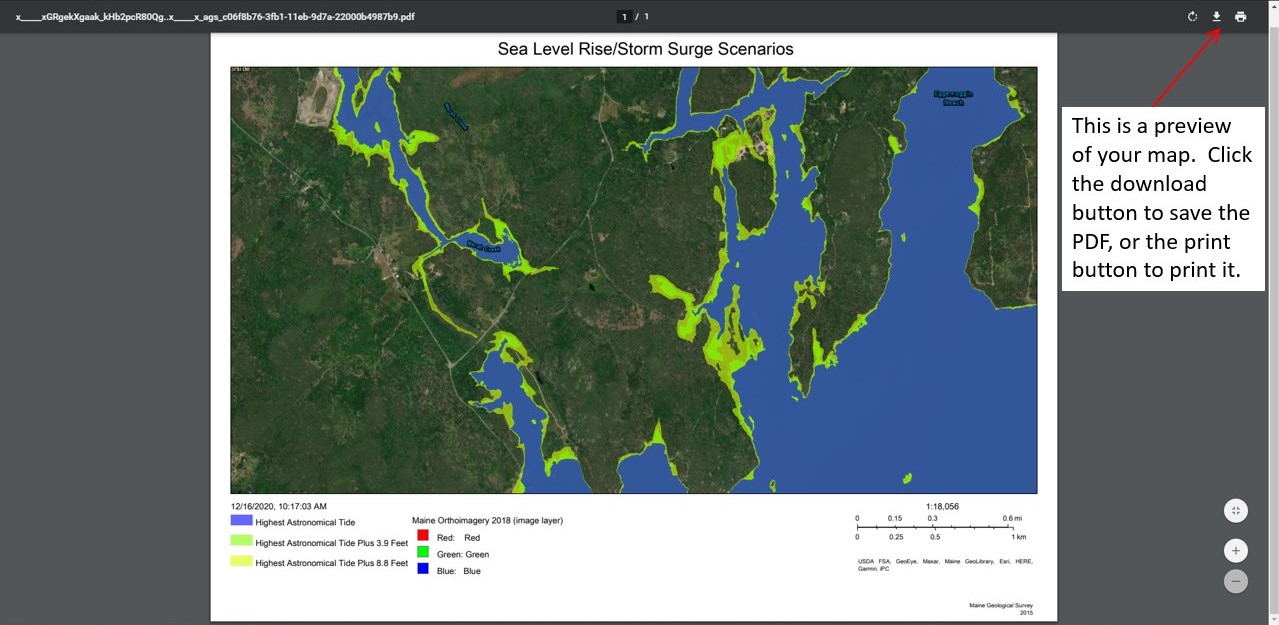
Q16. How do I print or download a map from the viewer? Back
Follow the directions in the following screenshots.
Last updated on September 29, 2023