DACF Home → Bureaus & Programs → Maine Geological Survey → Hazards → SLOSH Maps → FAQ
Potential Hurricane Inundation Mapping - Frequently Asked Questions
- Q1. What do the Sea, Lake, and Overland Surges from Hurricanes, or SLOSH maps, show?
- Q2. Why do we have to worry about hurricanes in Maine?
- Q3. How many hurricanes have hit Maine?
- Q4. When is the hurricane season?
- Q5. What is the current outlook for hurricane season?
- Q6. How is the strength of hurricanes described?
- Q7. How are potential flooding impacts from hurricanes simulated?
- Q8. What are the limitations of the SLOSH model?
- Q9. What’s the accuracy of the SLOSH model?
- Q10. How were the SLOSH map layers created?
- Q11. How are the SLOSH maps different from FEMA Flood Insurance Rate Maps (FIRMs)?
- Q12. What should the SLOSH maps be used for?
- Q13. What are the limitations of the SLOSH maps?
- Q14. Who created the SLOSH maps, and who paid for it?
- Q15. How can I get data for my town?
Q1. What do the Sea, Lake, and Overland Surges from Hurricanes, or SLOSH maps, show? Back
The layers show areas along the Maine coastline that might potentially be inundated by storm tides (the combination of a predicted tide and storm surge) under scenarios of landfalling Category 1, 2, 3, or 4 storms at mean high tide. Each scenario is shown as a distinct “band” representing potentially inundated areas. In order to view the entire area of inundation for a Category 3 event, one would need to turn on the bands displaying the Category 1, 2, and 3 events. Additional layers show potential inundation depths associated with each event, broken down into “bins” of 0-3 ft, 3-6 ft, 6-9 ft, and 9ft+ depths. Note that these layers show inundation of land areas only; large water areas (ocean, bays, large rivers) have been clipped out of the dataset. The “SLOSH Model Output” layer shows the output Maximum of Maximums (or MOMs) grids from the SLOSH model itself. These MOMs represent the worst-case storm surge scenarios for landfalling hurricanes based on the model. The values in these grids were the basis for interpolation of inundation from different category hurricane events over the land surface.
Q2. Why do we have to worry about hurricanes in Maine? Back
Although the threat in Maine is generally small compared with southern New England states, hurricanes can and do happen in Maine. Luckily, Maine sits at the “tail end” of tropical events, and due to our colder Gulf of Maine waters and geographic location, most hurricanes that cross into Maine have made landfall elsewhere and either weakened to tropical storms or become extra-tropical. That said, many of these events have still caused extensive damage, injuries, and even deaths. It is the responsibility of local, regional, and state governments to be prepared for and respond to these events.
Q3. How many hurricanes have hit Maine? Back
For this question, we assume “hit” means passed through Maine’s borders, either along the coast or inland. A great report by Cotterly (1996) documented tropical event impacts in Maine from the 1600s through 1996. NOAA also has a great web mapping application for investigating historical storms that have impacted Maine, or anywhere around the country. According to the NOAA site, 9 storms have been hurricanes as they passed through Maine’s land borders, with only 5 actually making actual “landfall” along the Maine coast.
These included:
- 1869 - Not Named (Category 2 and 1, landfall just east of Portland in Casco Bay)
- 1944 – Not Named (Category 1, landfall near Isle au Haut)
- 1954 – Hurricane Edna (Category 1, landfall near Mount Desert Island)
- 1969 – Hurricane Gerda (Category 2, landfall near Eastport)
- 1991 – Hurricane Bob (Category 2, but weakened to a tropical storm as it made landfall just off Southport)
Q4. When is the hurricane season? Back
Hurricane season in the Atlantic Basin (the Atlantic Ocean, Caribbean Sea, and Gulf of Mexico), begins June 1st and ends November 30th. However, the statistical peak of the season is on September 10th, and the tropics are typically most active from mid-August into October.
Q5. What is the current outlook for hurricane season? Back
The current NOAA Atlantic Hurricane Outlook is available from the Climate Prediction Center.
Q6. How is the strength of hurricanes described? Back
Hurricanes are classified into 5 categories using the Saffir-Simpson Hurricane Wind Scale, which is based on a hurricane’s sustained wind speeds. The scale was formulated in 1969 by Herbert Saffir, a consulting engineer, and Dr. Bob Simpson, director of the National Hurricane Center..
Q7. How are potential flooding impacts from hurricanes simulated? Back
The National Hurricane Center (in NOAA’s National Weather Service) developed the Sea, Lake, and Overland Surges from Hurricanes, or SLOSH model, to simulate potential flooding associated with landfalling tropical events. The SLOSH model is a computerized numerical model that estimates storm surge heights by taking into account the atmospheric pressure, size, forward speed, and storm track data. Outputs from the SLOSH model are potential overall water elevations, called “storm tides”, which might result from a landfalling hurricane. A storm tide is the overall water level that is achieved when combining the predicted tide with potential “storm surge” from a storm event. These outputs formed the basis for the creation of Maine’s Potential Hurricane Inundation Maps, or PHIMs. More information on SLOSH is available via the National Hurricane Center’s SLOSH web site. A paper describing how the SLOSH model is used for storm forecasting is available from the National Weather Service.
Q8. What are the limitations of the SLOSH model? Back
The SLOSH model outputs storm tide elevations, which are a combination of predicted normal tides (for mean tide and mean high tide) and storm surge associated with an event. It does not take into account the potential impacts from waves, extreme tides, freshwater flow, precipitation, or potential future scenarios of sea level rise.
Q9. What’s the accuracy of the SLOSH model? Back
According to the National Hurricane Center, the published accuracy of the SLOSH model is about �20%, based on comparison of SLOSH predictions with measured high water marks and tide gauge data after storms. That means that if the model outputs an expected storm tide of 10 feet, the actual on-the-ground elevation could range from 8 feet (-20%) to 12 feet (+20%). Although this is the published accuracy, additional studies show that the model can be more accurate than 20%. The National Hurricane Center recently published a paper which compared SLOSH predictions with actual measured high water marks in NJ, NY, RI, and CT from Hurricane Sandy, and found that the SLOSH model simulated actual water levels with errors less than 10% about 34% of the time, 20% about 71% of the time, and less than 30% about 89% of the time. Additionally, WNYC created an web site that qualitatively compares predicted hurricane surge zones from SLOSH modeling with the extent of actual flooding from Hurricane/Superstorm Sandy for the New York and New Jersey areas.
Q10. How were the SLOSH map layers created? Back
In 2013, the Maine Geological Survey (MGS) and Maine’s Floodplain Management Program (MFMP) created Potential Hurricane Inundation Maps, or PHIMs, with funding through a FEMA Cooperating Technical Partners (CTP) grant to the Floodplain Management Program. Members from the National Hurricane Program (FEMA and the US Army Corps of Engineers), and Maine’s Emergency Management Agency (MEMA), helped review the methodology, creation of the maps, and support documents.
To create the PHIMs, the NHC SLOSH model was used to create “Maximum of Maximum Envelopes of Water” (or MOMs) for Category 1 and 2 hurricanes making landfall at either mean tide or mean high tide. A GIS-based tool was developed that took the MOMs and created a grid of potential storm tide water elevations, and interpolated storm tide elevations inland. This data was then overlaid onto highly accurate topographic data (from Light Detection and Ranging, or LiDAR) of the Maine coastline. The grids were then subtracted, and areas of land below the water elevations were deemed to be “flooded” while areas above the water elevations were considered to be “dry”. This resulted in data that was released as Maine’s Potential Hurricane Inundation Maps, or PHIMs.
This previous PHIM mapping effort led to the creation of updated Category 1 to 4 SLOSH data layers by the National Hurricane Partner agencies of the US Army Corps of Engineers and FEMA. As part of this process, NHP partners first checked the original PHIMs. Then, using mapping techniques very similar to the creation of the PHIMs, created additional Category 3 and 4 event inundation data, which are required for updating Maine’s hurricane evacuation plans. This resulted in official NHP products that could be used for hurricane evacuation planning. The new Category 1 to 4 (at mean high tide only) SLOSH map layers supersede the previously created PHIM layers. Additional outputs include layers showing potential inundation depths associated with the different events. These depth layers were created by subtracting land surface elevations from the overall storm tide levels; the resulting data indicates potential inundation depths on top of the land surface. See the metadata for the datasets for additional information.
In order to easily and quickly display the data in the ArcGIS Online web map, the polygon data was converted to a tiled feature service. The original polygon data for each county can be downloaded for use in GIS for further analysis.
Q11. How are the SLOSH maps different from FEMA Flood Insurance Rate Maps (FIRMs)? Back
The Federal Emergency Management Agency (FEMA) produces FIRMs in support of the National Flood Insurance Program (NFIP). They are regulatory documents that identify Special Flood Hazard Areas where land use and building requirements of the NFIP need to be enforced. They are used for floodplain management regulations, to set flood insurance rates, and to identify where flood insurance is required as a condition of a federally-backed mortgage. Flood zones on FEMA FIRMs are based on storm surge and wave action from the flood that has a 1% chance of being equaled or exceeded in a given year (also known as the “100-year flood”).
On the other hand, the Potential Hurricane Inundation Maps are emergency preparedness and planning documents for events that don’t have occurrence probabilities, and are not intended to be used for regulatory or insurance purposes.
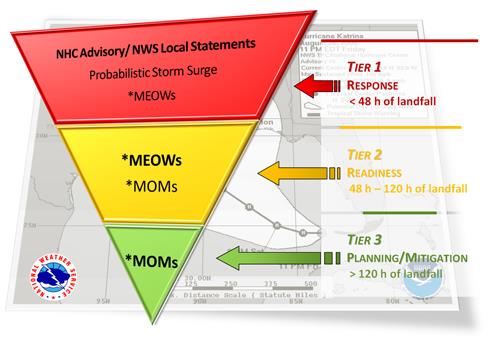
Q12. What should the SLOSH maps be used for? Back
The SLOSH maps should be used for Tier 3 emergency preparedness and general planning. These products were created by the National Hurricane Partnership, and are considered to be official National Hurricane Center products for evacuation planning in Maine. The SLOSH map layers were used to create Maine’s updated Hurricane Evacuation Plans.
Q13. What are the limitations of the SLOSH maps? Back
Users should recognize that there are accuracy limitations to each of the data sources used to create maps that depict the hurricane inundation areas. As stated previously, the SLOSH model hurricane storm tide elevations have an accuracy of �20% when compared with actual high water marks from storm events. The vertical accuracy of LiDAR topographic data is approximately � 1 foot, and the horizontal accuracy is approximately � 6 feet. In addition, the LiDAR dataset used to create the maps is a “bare earth” model – that means that trees, buildings, piers, and bridges have been removed as part of the data processing. Thus, it may appear that a bridge or pier is flooded, when in actuality, the bridge or pier was removed in the creation of the LiDAR bare earth dataset.
Note that the potential inundation depth layers have been broken into depth ranges of 0-3 ft, 3-6 ft, 6-9 ft, and greater than 9 ft depth. These numbers should be used as general guidance, and may not reflect actual on-the-ground conditions.
Users should also expect some discrepancies between other data layers (e.g., road datasets, orthoimagery, etc.) and the hurricane inundation areas due to scale and registration errors.
Q14. Who created the SLOSH maps, and who paid for it? Back
Original PHIMs were created by the Maine Geological Survey and Maine’s Floodplain Management Program. Members from the National Hurricane Program (FEMA and US Army Corps of Engineers) and Maine’s Emergency Management Agency helped review the methodology, creation of the maps, and support documents. Funding was provided through a FEMA Cooperating Technical Partners (CTP) grant to the Floodplain Management Program. The SLOSH maps which supersede the PHIMs were created by the US Army Corps of Engineers and FEMA through internal funding at the Corps and technical input from MGS, the Floodplain Management Program, and MEMA.
Q15. How can I get data for my town? Back
MGS built an ArcGIS Online web mapping application that allows users to view and download the SLOSH data. A user can download either a PDF map of a particular area of interest (maximum scale of 1:4800), or the actual GIS data for use in another application. If you have an internet connection, you can use this web mapping application from a computer or a mobile device.
Last updated on March 6, 2019