Monthly Earnings from Cash Pool Distributions
Fiscal Year 2025
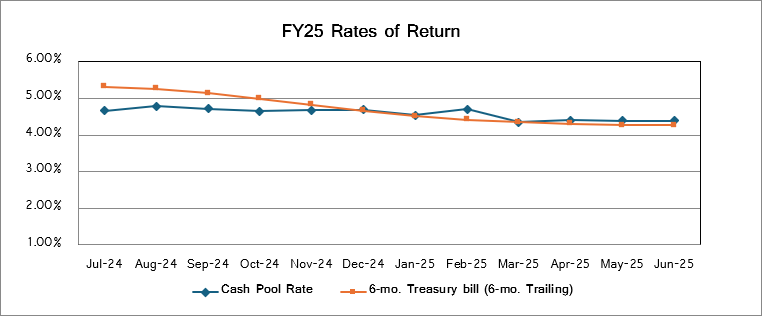
| Mo. Of Earnings | Following Month Dist. | Prev. Mo. Earnings Distributed | PFM Avg Historical Cost | ADVANTAGE Avg Daily Balance Total | Days in Mo. | Cash Pool Rate | 6-mo. Treasury bill (6-mo. Trailing) |
| Jul-24 | Aug-24 | $ 16,781,679.17 | $4,253,963,809.40 | $ 4,020,421,777.43 | 31 | 4.66% | 5.32% |
| Aug-24 | Sep-24 | 16,740,891.49 | 4,136,081,561.20 | 4,000,334,714.02 | 31 | 4.78% | 5.26% |
| Sep-24 | Oct-24 | 15,885,005.70 | 4,103,005,677.24 | 3,970,128,088.17 | 30 | 4.72% | 5.14% |
| Oct-24 | Nov-24 | 16,017,424.49 | 4,074,252,404.17 | 3,941,182,790.78 | 31 | 4.64% | 4.99% |
| Nov-24 | Dec-24 | 15,050,298.87 | 3,932,434,534.73 | 3,799,741,415.92 | 30 | 4.67% | 4.83% |
| Dec-24 | Jan-25 | 15,373,933.75 | 3,868,187,521.34 | 3,734,052,987.89 | 31 | 4.69% | 4.66% |
| Jan-25 | Feb-25 | 15,096,641.23 | 3,915,458,403.96 | 3,797,724,504.97 | 31 | 4.54% | 4.51% |
| Feb-25 | Mar-25 | 13,585,891.30 | 3,770,975,968.74 | 3,671,561,392.81 | 28 | 4.70% | 4.41% |
| Mar-25 | Apr-25 | 13,217,403.68 | 3,575,722,736.62 | 3,479,081,935.81 | 31 | 4.35% | 4.35% |
| Apr-25 | May-25 | 13,076,050.89 | 3,613,567,735.50 | 3,483,237,647.47 | 30 | 4.40% | 4.31% |
| May-25 | Jun-25 | 14,480,201.52 | 3,884,662,308.94 | 3,696,101,772.91 | 31 | 4.39% | 4.27% |
| Jun-25 | P12 | 13,420,382.87 | 3,722,971,626.50 | 3,655,477,126.77 | 30 | 4.39% | 4.27% |
| FY24 | FY17 Sum/Average | $178,725,804.95 | $ 3,904,273,690.70 | $ 3,770,753,846.25 | 4.58% | 4.69% |
Treasurer's Cash Pool Rates (%)
FY 2014-2025
| Month/FY | FY25 | FY24 | FY23 | FY22 | FY21 | FY20 | FY19 | FY18 | FY17 | FY16 | FY15 | FY14 |
| July | 4.66 | 3.23 | 1.01 | 0.46 | 0.77 | 2.38 | 1.65 | 1.06 | 0.73 | 0.35 | 0.30 | 0.23 |
| August | 4.78 | 3.38 | 1.35 | 0.47 | 0.73 | 2.29 | 1.74 | 1.12 | 0.72 | 0.42 | 0.40 | 0.31 |
| September | 4.72 | 3.55 | 1.51 | 0.47 | 0.73 | 2.23 | 1.84 | 1.14 | 0.75 | 0.43 | 0.35 | 0.40 |
| October | 4.64 | 3.72 | 1.81 | 0.45 | 0.69 | 2.09 | 2.04 | 1.22 | 0.79 | 0.42 | 0.28 | 0.25 |
| November | 4.67 | 3.79 | 2.05 | 0.47 | 0.67 | 1.99 | 2.15 | 1.25 | 0.81 | 0.41 | 0.35 | 0.25 |
| December | 4.69 | 3.96 | 2.22 | 0.50 | 0.71 | 1.96 | 2.15 | 1.25 | 0.82 | 0.48 | 0.33 | 0.32 |
| January | 4.54 | 4.21 | 2.51 | 0.48 | 0.69 | 1.90 | 2.24 | 1.21 | 0.84 | 0.46 | 0.43 | 0.35 |
| February | 4.70 | 4.15 | 2.59 | 0.49 | 0.63 | 1.86 | 2.30 | 1.34 | 0.86 | 0.48 | 0.41 | 0.27 |
| March | 4.35 | 4.19 | 2.52 | 0.57 | 0.67 | 1.76 | 2.30 | 1.28 | 0.87 | 0.63 | 0.49 | 0.27 |
| April | 4.40 | 4.34 | 2.61 | 0.46 | 0.69 | 1.16 | 2.39 | 1.43 | 0.97 | 0.67 | 0.37 | 0.23 |
| May | 4.39 | 4.50 | 2.98 | 0.56 | 0.57 | 0.83 | 2.42 | 1.53 | 0.96 | 0.67 | 0.41 | 0.25 |
| June | 4.39 | 4.66 | 3.14 | 0.79 | 0.50 | 0.81 | 2.42 | 1.61 | 1.05 | 0.68 | 0.36 | 0.28 |
| Average | 4.58 | 3.97 | 2.19 | 0.51 | 0.67 | 1.77 | 2.14 | 1.29 | 0.85 | 0.51 | 0.37 | 0.28 |
Historical Month-End Fund Balances (Controller's Balances)