Food Insecurity Fact Sheets
View and Download Food Insecurity Fact Sheets by County
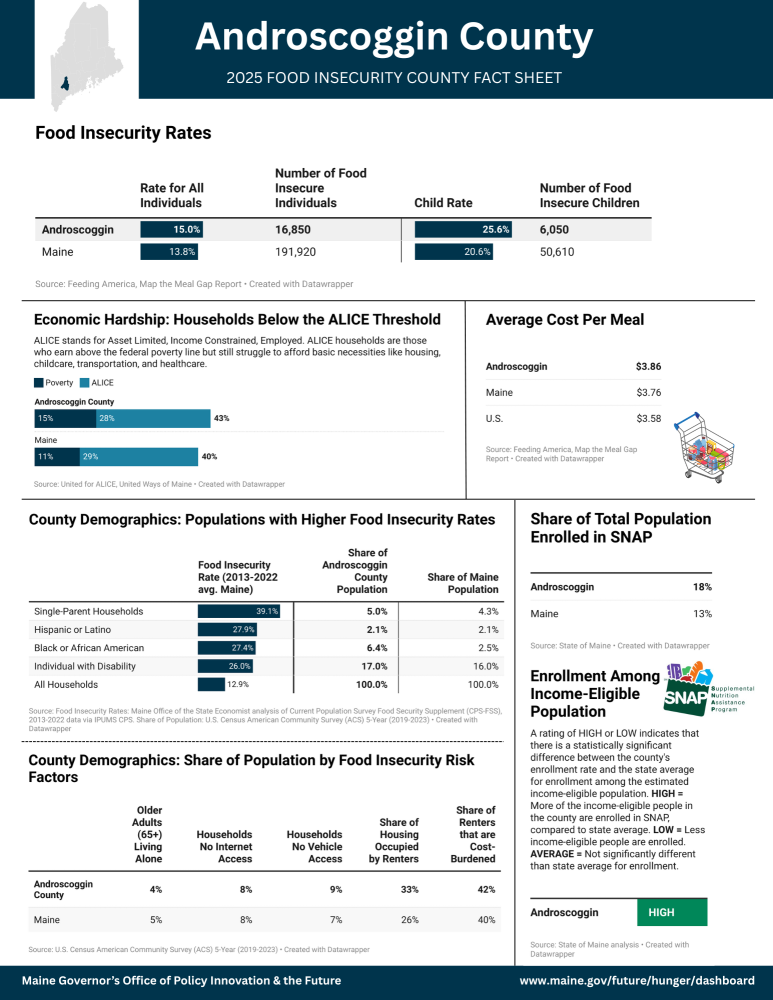
- Androscoggin
-
-
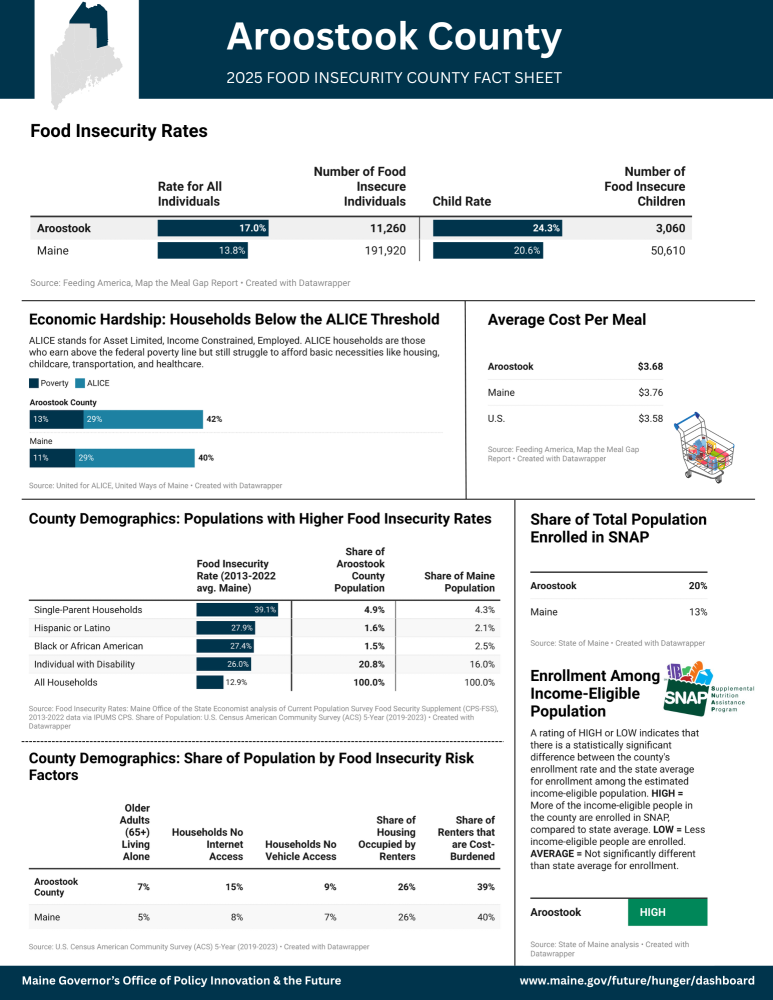
- Aroostook
-
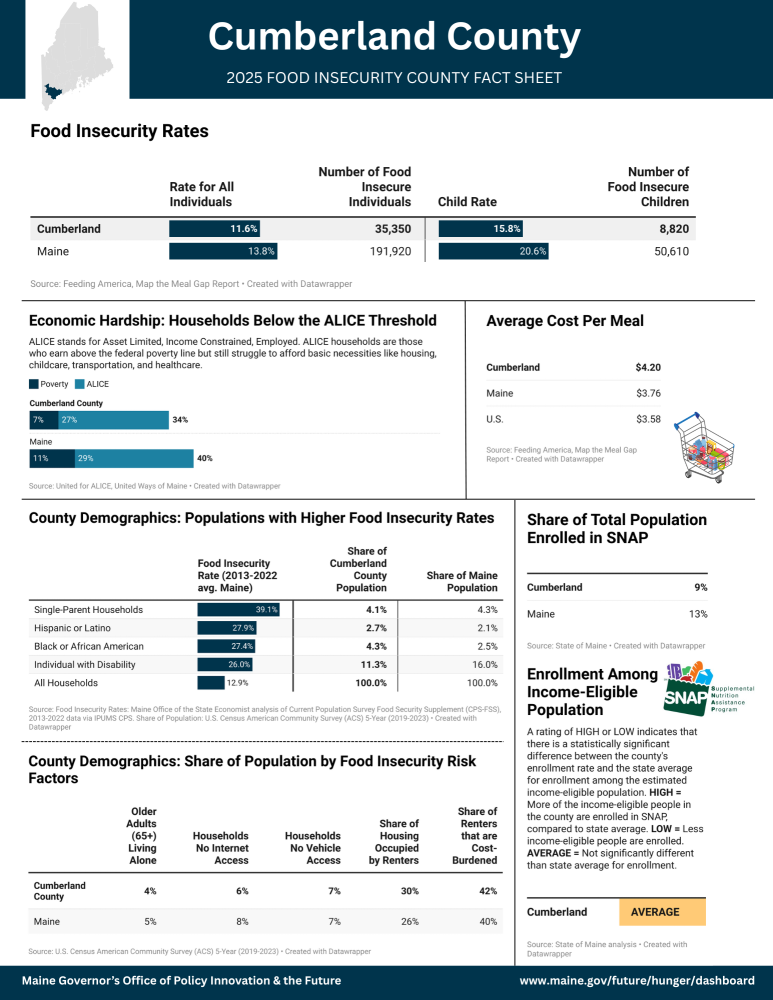
- Cumberland
-
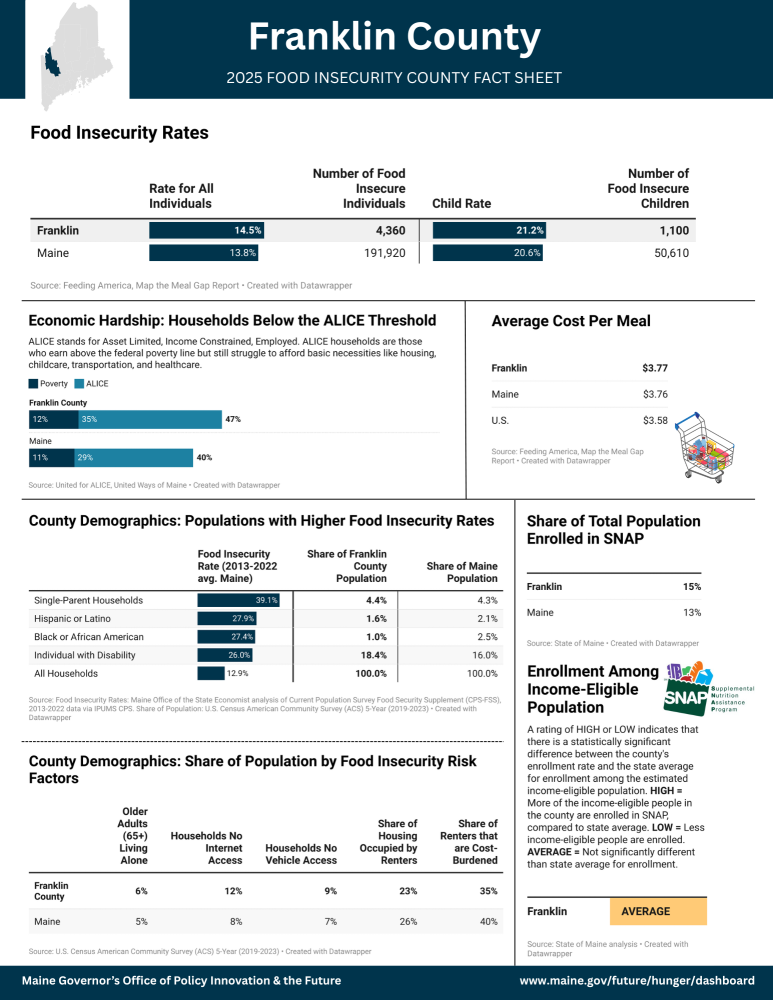
- Franklin
-
- Hancock
-
- Kennebec
-

- Knox
-

- Lincoln
-

- Oxford
-

- Penobscot
-
- Piscataquis
-

- Sagadahoc
-

- Somerset
-
- Waldo
-

- Washington
-

- York
-
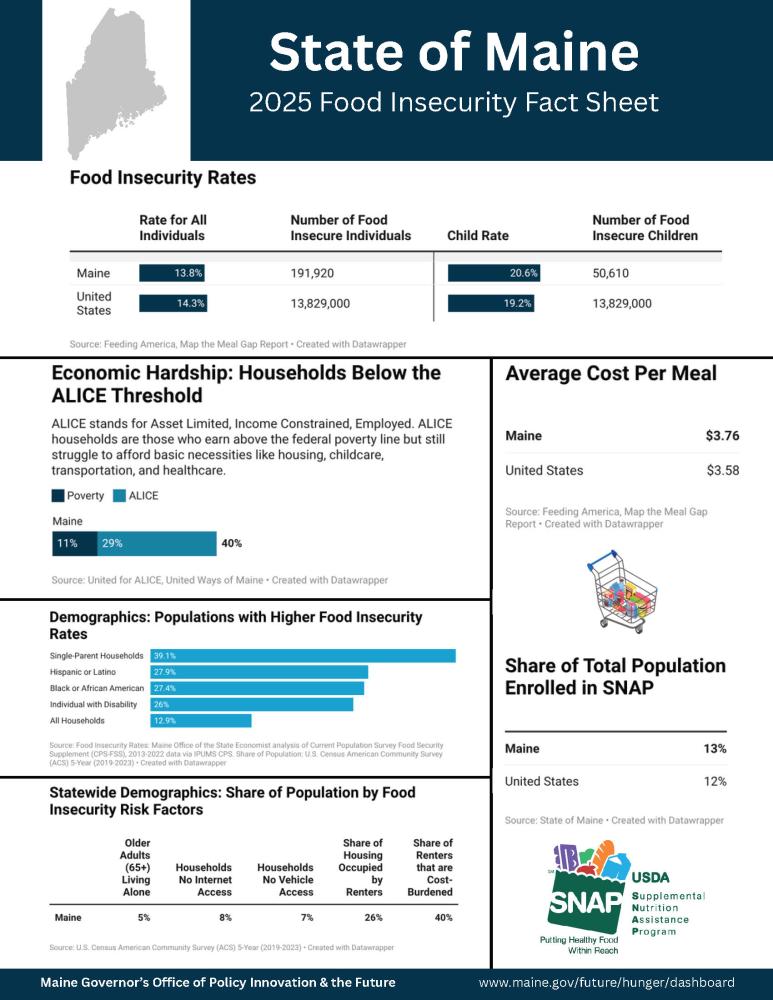
View and Download the State Fact Sheet
About the Data: Sources and Notes
The metrics included in the county fact sheets were selected by the Senior Anti-Hunger Policy Advisor and sourced with support from the Maine Office of the State Economist. Find more details and sources for the data here.
Food and Economic Security Metrics
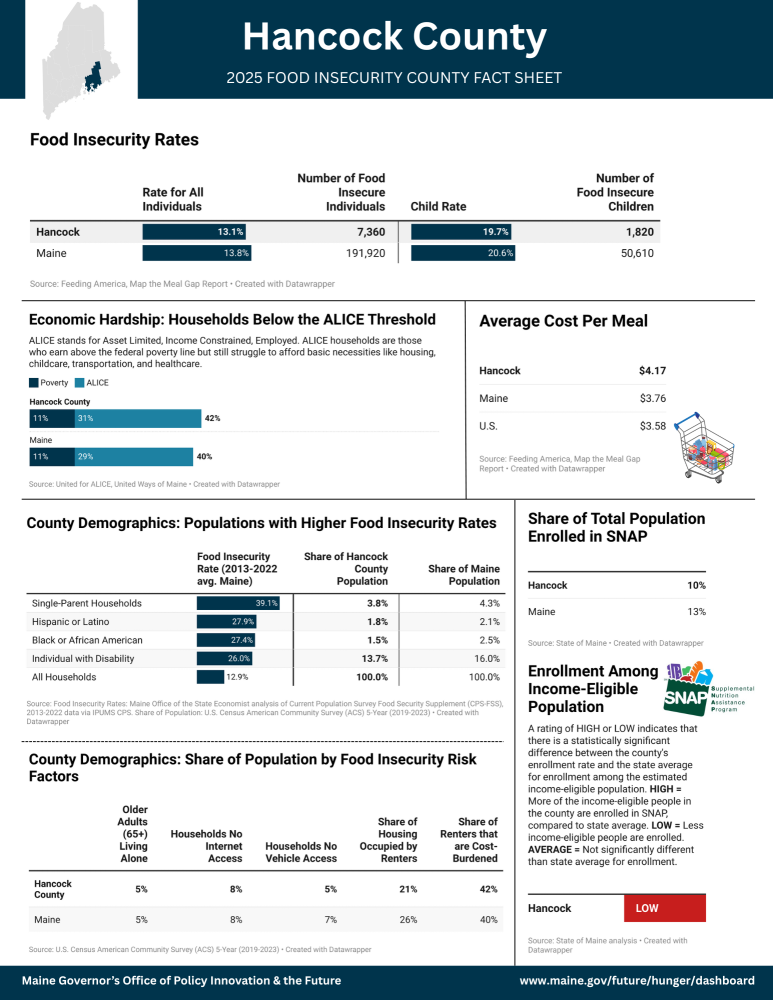
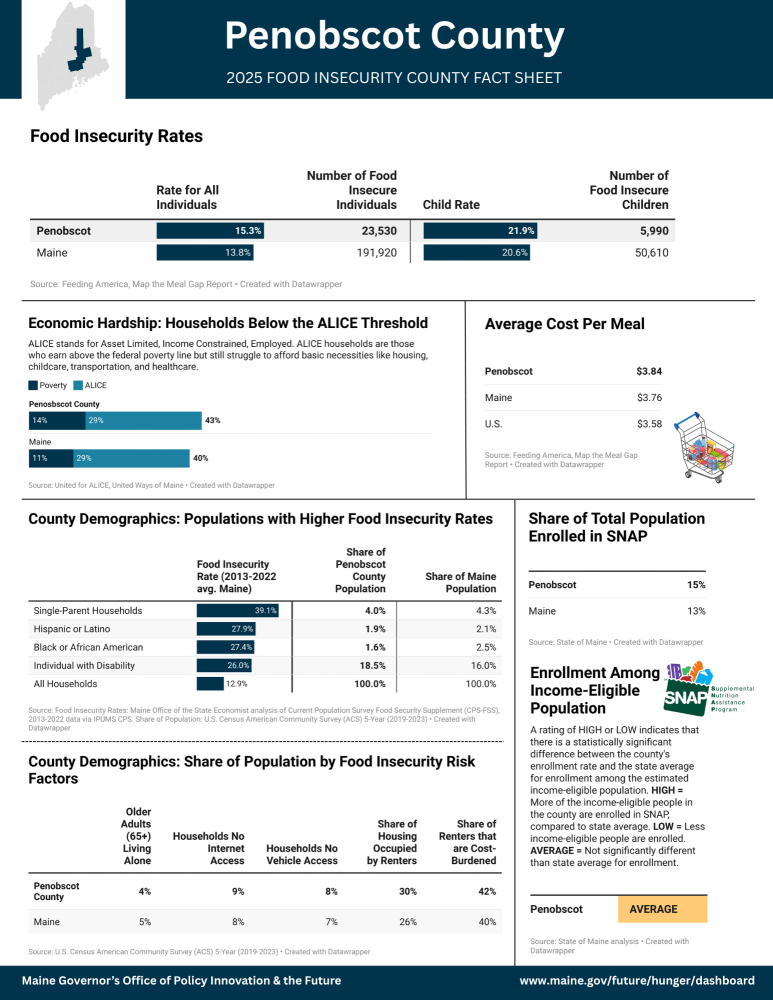
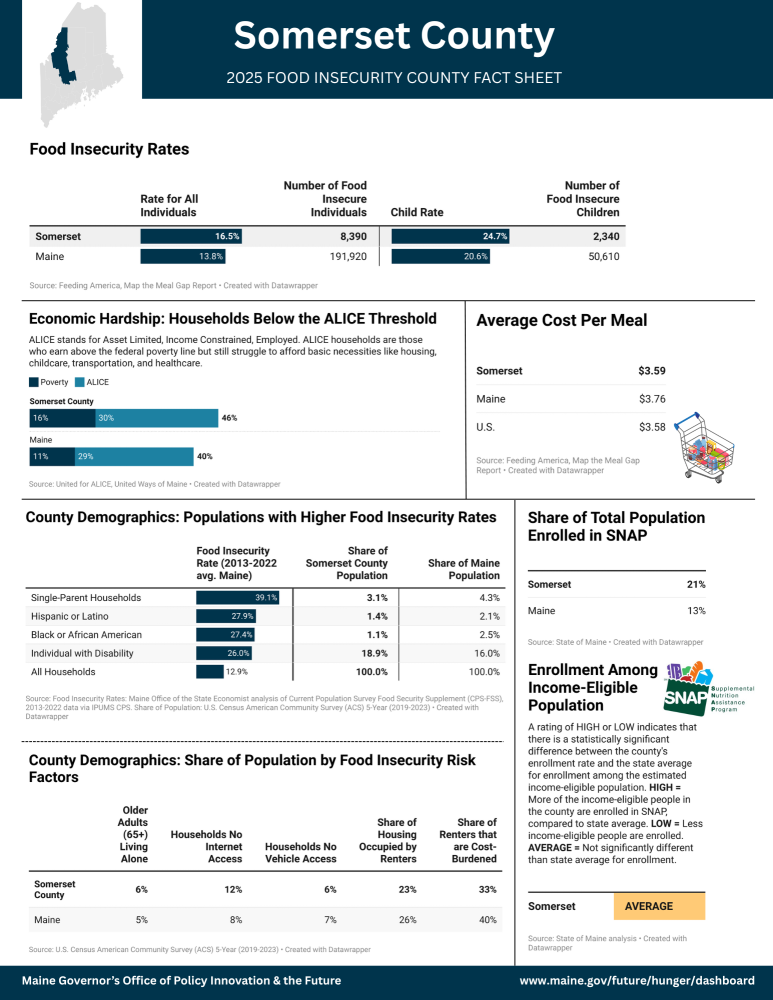
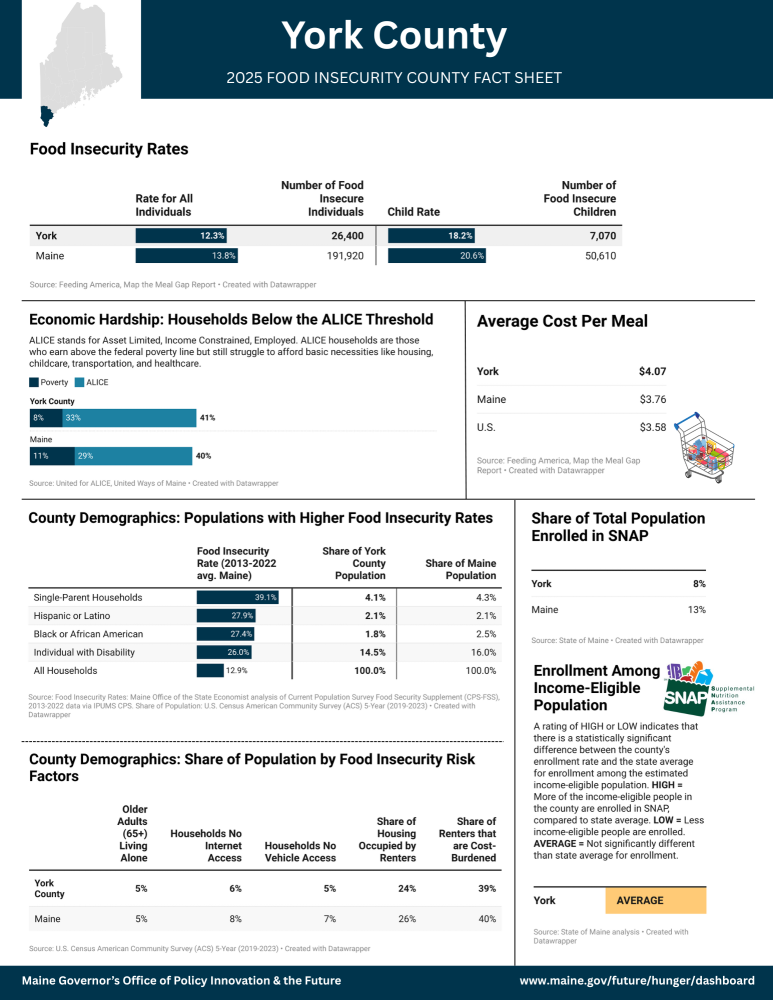
Food Insecurity Rate (Overall, child, state, and county)
Source: Feeding America Map the Meal Gap, 2023 data in 2025 report (released annually in May)
Notes: Feeding America makes an estimate of rates at the individual level, not household as the USDA report does. See methodology here.
Economic Hardship (Poverty and ALICE rate)
Source: United for ALICE, a project of United Way. 2023 data updated in a 2025 report.
Notes: The ALICE Threshold represents a broader measure of economic hardship than the traditional Federal Poverty Level (FPL). ALICE stands for Asset Limited, Income Constrained, Employed. ALICE households are those who earn above the FPL but still struggle to afford basic necessities like housing, childcare, transportation, and healthcare. Households below the ALICE threshold include ALICE households and households below the FPL.
Average Cost Per Meal
Source: Feeding America Map the Meal Gap, 2023 data in 2025 report (released annually in May)
Notes: The average dollar amount spent on food per week by food-secure individuals is divided by 21 (three meals per day * seven days per week). We then weight the national average cost per meal by the “cost-of-food index” to derive a localized estimate. More details in methodology here.
Rate of Households at Higher Risk of Food Insecurity by Indicator: County and state population characteristics
These indicators were selected because of their association with increased risk of food insecurity and barriers to food assistance, and because of their availability at the county and state level. All indicators are sourced from the U.S. Census American Community Survey (ACS) 5-Year estimates because of their availability at the county level. The latest data is for 2019-2023. The data is released each year in December.
Single-Parent Households
- Source: U.S. Census ACS 5-Year: DP02 Selected Social Characteristics: Male householder, no spouse/partner present with children under 18, Female householder no spouse/partner present with children under 18
- Notes: Male householder and Female householder were combined because they are only reported separately for “Householder, no spouse/partner present, With children of the householder under 18 years”.
Disability Rate
- Source: ACS 5-Year percent of the total civilian noninstitutionalized population with a disability, DP02: Selected Social Characteristics, Disability Status of the Civilian Noninstitutionalized Population, with a disability.
Older Adults (65+) Living Alone
- Source: ACS 5-Year Percent of the total population that are older adults (65+) living alone, S1101 Households and Families, Householder living alone, 65 years and over.
Renter Occupied Housing Units
- Source: ACS 5-Year Share of the total occupied housing units that are renter occupied, https://data.census.gov/table/ACSDT5Y2023.B25003?t=Owner/Renter+(Tenure)&g=040XX00US23,23$0500000.
- Notes: This metric is included because renters are at higher risk of food insecurity: https://www.census.gov/newsroom/archives/2016-pr/cb16-193.html.
Renters Housing Cost Burdened
- Source: ACS 5-Year Renter occupied units where rent is more than 30% of income, B25140: Housing Costs as a Percentage of Household income in the past 12 months, Owned units with a mortgage >30%, owned units without a mortgage>30%, rented >30%.
- Notes: Renter-occupied units where rent is more than 30% of income, divided by the total number of renter-occupied units as the universe.
Households No Vehicle Access
- Source: ACS 5-Year Data "Percent of Occupied Housing Units with No Vehicles Available", DP04: Selected Housing Characteristics, No vehicles available, percent.
- Notes: Ample research identifies lack of vehicle access as a primary factor influencing household food insecurity. A literature review conducted by the University of NH Carsey School of Public Policy finds: “Having available transportation is more consistently linked to food access than is a minimal distance between home and store. Research consistently identifies transportation as a meaningful element of food accessibility, linking both lack and cost of transportation to food insecurity. Evidence of this relationship is strong enough that one review paper concludes ‘Of all the factors that seemingly limit access to food, the most important is no money but second in importance is no car.’”
Households No Internet Access
- Source: ACS 5-Year Percent of households without internet access: Calculate number with no internet access divided by total households, B28011: Internet Subscriptions in Household, No internet access.
- Notes: Home internet access impacts both economic opportunity and access to information, resources, and assistance; for example, applying for benefits like SNAP online or finding nearby food pantry locations.
SNAP Utilization Data
Share of Total County Population Enrolled in SNAP
Sources:
- County population: Census Population Estimates Program, Vintage 2023 (Population Estimate for July 1, 2023).
- SNAP participation: Monthly average of SNAP participants, all SNAP types, 2023 (Office of Family Independence, Maine DHHS). A monthly average across the calendar year was used to account for seasonal variability in SNAP participation.
Share of Estimated Income-Eligible Population Enrolled in SNAP
Sources:
- Estimated income-eligible population at the county level at 125% FPL: American Community Survey 5-Year Estimates (Calendar Year 2019-2023).
- SNAP Participants at County-Level: Monthly average of SNAP participants, all SNAP types with household income below 125% FPL, and below 200% FPL, 2023 (Office of Family Independence, Maine DHHS).
Notes: Analysis was conducted through a coordinated effort by the Governor’s Office of Policy Innovation and the Future, the Maine Office for Family Independence, and the Maine Office of the State Economist. Maine’s SNAP income threshold is 200% FPL. This analysis utilizes 125% FPL to estimate the income-eligible population because it is the ACS metric available at the county level that is closest to the net income limit for SNAP of 100% FPL.