DACF Home → Bureaus & Programs → Maine Geological Survey → Maps, Publications and Online Data → Using Geologic Maps → Reading Coastal Landslide Hazards Maps
Reading Coastal Landslide Hazards 1:24,000-scale Maps
What's on the maps?
A coastal landslide hazards map shows the potential landslide hazards along a section of the Maine coast and describes the internal stability of sediment bluffs and their potential to rapidly move large amounts of land downslope under the influence of gravity. Related coastal bluffs maps describe the processes and stability of the face of a bluff. These maps do NOT show erosion trends on beaches or sand dunes.
Uses of the maps
Maine's coastal bluffs provide a dramatic and beautiful setting in which to live. Sweeping views of the ocean considerably increase property values, making available properties much sought after. Landowners or potential buyers, however, need to be aware of the potential risks of owning coastal bluff properties. A variety of geologic factors, including continuing coastal erosion, make some of these properties susceptible to bluff failure which causes landslides. A landslide on the north shore of Rockland harbor in 1996 heightened public awareness of this hazard. Coastal landslide hazards maps provide an introduction to understanding landslide risk and guidance on what steps to take if the risk of a landslide is a concern in a particular coastal area.
Definitions
Understanding the following terms will help you interpret what you see on a coastal landslide hazards map.
What is a landslide?
Landslides are the rapid movement of earth materials downslope under the force of gravity.
What is a coastal bluff?
On this map, a bluff is defined as a steep shoreline slope formed in sediment (loose material such as clay, sand, and gravel) that has three feet or more of vertical elevation just above the high tide line. Cliffs or slopes in bedrock (ledge) surfaces are not bluffs and are not subject to significant erosion in a century or more. Beaches and dunes do not form bluffs, except along the seaward dune edge as a result of erosion.
Where is the bluff face?
The bluff face is the sloping land surface at the edge of a bluff (Figure 1).
Figure 1. Cross section of coastal bluff showing location of the bluff face.
What is a scarp?
A scarp is a steep face on the undisturbed ground at the edge of a landslide (Figure 2). It is formed when landslide blocks slide away from the undisturbed ground.
Figure 2. Cross section of coastal bluff showing location of scarp and slump blocks.
What is a slump?
A slump is a type of landslide characterized by shearing and rotary movement of sediment blocks (see Figure 2).
What is soil creep?
Soil creep is the slow, continuous downslope movement of soil on a slope caused by gravity.
Tips for Reading the Maps
What are the colored bands along the coastline?
The landslide hazard classification is indicated by a colored band extending landward from the shoreline (dark blue line). The colors represent potential landslide hazards (see the map explanation (pdf) and map sidebar (pdf) for more information).
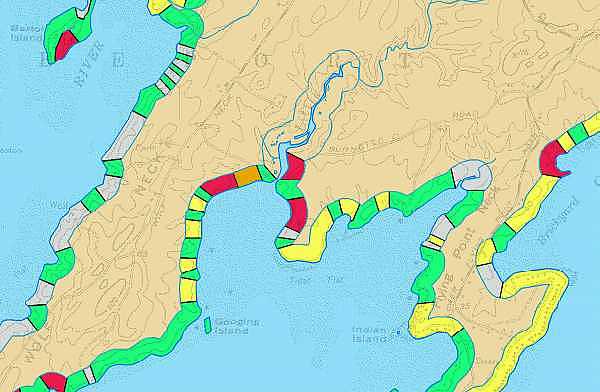
Figure 3. Colored bands shown on Coastal Landslide Hazards Maps.
Does the width of the colored band have meaning?
The colored buffer is for illustration purposes only. The width of the band DOES NOT indicate the distance inland that a landslide may occur. This distance is difficult to predict and will vary from site to site.
How accurate are the risk categories?
The risk categories are based on direct observations and interpretation of aerial photos and maps. Categories are listed below in descending order of accuracy:
- Landslide sites, shown in red, are the most accurate and reliable locations. They are based on eyewitness accounts, historical records, and interpretation of landslides from aerial photography.
- Landslide risk areas, shown in orange, are interpretive and are based on observations of the shape and composition of the land surface. High muddy bluffs with scarps and slump blocks fall into this category.
- Potential landslide areas, shown in yellow, are based mainly on the elevation and steepness of the bluff.
- Low coastal bluffs and non-bluff shorelines, in general, are not at risk of landslides.
For more information, refer to the "Methods of Mapping Landslide Hazards" in the map explanation (pdf).
Is it possible for the classification to change over time?
It is certainly possible for coastal land to change over time. Some changes, either natural or from land alteration or shoreline engineering, may cause a segment of the shoreline to have a different level of landslide risk than what is shown on the map. Continued chronic erosion on the face of a bluff may make the slope on a bluff steeper and more likely to fail via a landslide. An area that has experienced a landslide may have less risk of future landslides, but the land may still be unstable and subject to minor amounts of settlement. Where the height of a bluff has been reduced and graded to a lower slope, the risk of a landslide may also have decreased (see Aftermath of the 1996 Rockland Landslide). Check with the date of the fieldwork listed on the map legend to see how long ago the observations were made and consider a visit to a site of particular interest after carefully studying the map and criteria for each map unit. You may find evidence that the classification has changed. For the latest up-to-date assessment you may want to hire a certified geologist or engineer to review the site history and current risk.
The north shore of Rockland (Figure 4a,b,c) is an example of where the classification has changed over time. A landslide in 1996 resulted in a significant loss of land on and above a coastal bluff. Subsequent grading of the land and construction of riprap engineering along some parts of the shore altered the coastal bluff to make it more stable so a map change along part of the shore is in order.
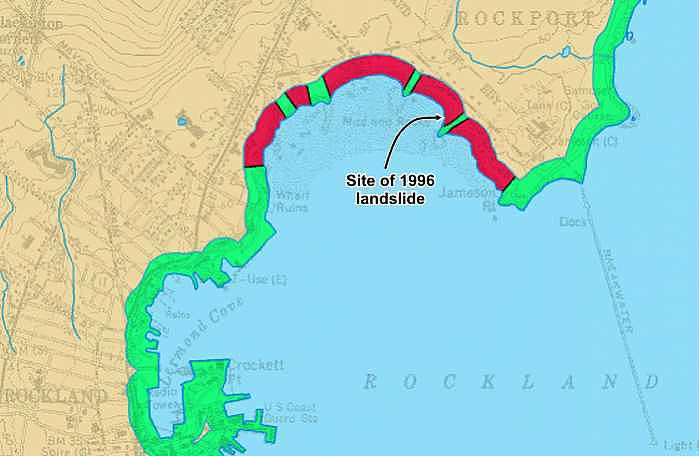
Figure 4a. A portion of the Rockland Coastal Bluffs map showing the area landslide of the 1996 landslide.
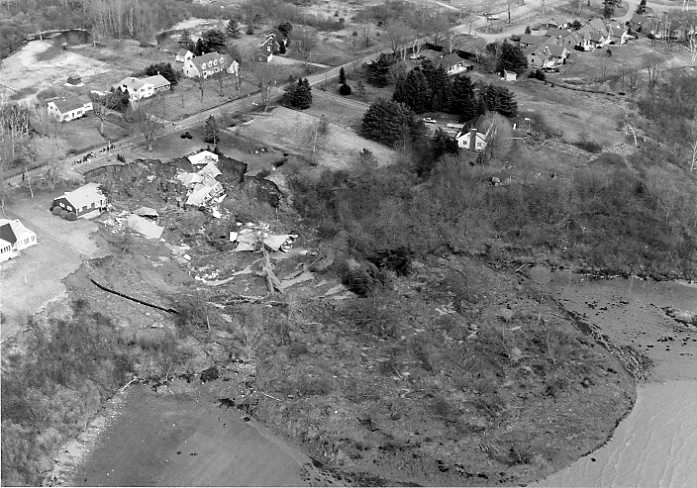
Figure 4b. Aerial photo of the 1996 Rockland landslide.
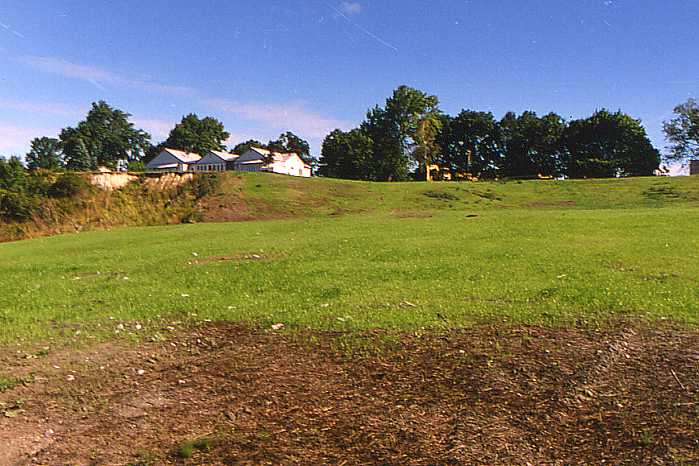
Figure 4c. The Rockland landslide area after remediation.
Are the category boundaries generalized?
This map is intended to provide only general information on coastal landslide hazards. It is not intended to be the sole basis upon which specific land-use decisions are made. Because of the map scale, shoreline characteristics are generalized into segments 150 feet or more in length. It is important to realize that the landslide hazard classification only shows the average hazard inferred for each section of the shoreline. For an evaluation of site-specific landslide potential, you should contact a certified geologist or geotechnical engineer.
What is the best way to use this map when looking at coastal property?
Property that is already developed may be adjacent to a shoreline with a risk of landslides identified on the map. If that is the case, check the complete map legend in order to understand the risk category as well as the processes that contribute to landslides. Examine the property to look for factors that might indicate that the risk is still there. A site walk might reveal surface water runoff that disappears into the ground above the bluff. There might be signs of a high ground-water table (wet lawns, water running down the face of the bluff, etc.) and erosion on the face of the bluff. Areas of adjacent shoreline may show relict landslide scarps or down-dropped blocks. It is also worthwhile to examine the companion map of Coastal Bluffs to see if the bluff was identified as unstable or highly unstable since continued bluff erosion can oversteepen a coastal bank and make it less supportive of the adjacent upland. Measure the distance from the top of the bluff to the nearest structure on the property. Some landslides have moved land more than 200 feet inland from the bluff edge. The closer a structure is to the top of a bluff, the more likely it is that it could be within a zone that moves rapidly. Consider the impact of landscaping, building additions, swimming pools, driveways, and other new land uses on factors that might increase the landslide risk (see the map sidebar (pdf) to understand processes that contribute to landslides). Land-use changes on the site, and perhaps even on adjacent properties (both along the shore and inland), may over time either increase or decrease the risk of a landslide on a property. Since the risk is very site-specific, a geological or geotechnical investigation might help with coastal property decisions in potential landslide risk areas as well as on and around former landslide sites.
Is this map useful for evaluating land for new coastal development?
This map can be used as preliminary guidance for evaluating land for new coastal development. If an area is identified as a former landslide site, a landslide risk area, or a potential landslide area, then before siting or constructing a new building you should consider having professionals evaluate the site to determine the risk of earth movements and its ability to support the additional load of buildings. Where the map identifies a risk along the shoreline, there may be less risk farther inland on a parcel of land. For example, some ground landward of a coastal bluff may be supported from below by shallow bedrock (ledge) and would therefore be quite stable. Subsurface investigations were not used in the process of mapping the shoreline, but non-invasive geophysical methods (such as ground-penetrating radar) can be used for site evaluation. In some locations, remediation at the site might reduce the probability of landslides and hence the risk to new development. These maps are not regulatory in nature, so consult municipal shoreland zoning ordinances and maps if you are planning to build along the coast.
Tips for Reading the Maps - Related Maps
How does the coastal landslide hazards map relate to a coastal bluffs map?
The coastal landslide hazards map and the coastal bluffs maps are companions. They each show a different aspect of the shoreline. The coastal bluffs map describes what happens on the face of a bluff and indicates how stable the bluff is with a simple color pattern of red, yellow, and green. The coastal bluffs map also shows what the shoreline at the high tide line is composed of (rock, armor, marsh, or beach). Each of these shoreline types also can be used to understand the nature of the bluff above the high-tide line.
The coastal landslide hazards map is based, in part, on the presence of a coastal bluff. A high bluff is a necessary condition for a site to be landslide-prone. There are, however, some coastal lowlands without bluffs immediately along the shoreline that are former landslide sites. In essence, the landslide removed the bluff that was once rising from the high-tide line and slumped earth materials down to form a non-bluff shoreline. There may still be a landslide scarp or bluff some distance inland at such a location, but the landslide would not show up on a coastal bluffs map because a bluff is no longer immediately along the shoreline (it is now perched above the slide blocks). Where these relict landslides are known, they are shown on the coastal landslides hazard map.
How does the coastal landslide hazards map relate to a surficial geology map?
Coastal landslide hazards are most likely to occur in areas with surficial sediments of the Presumpscot Formation (composed mostly of glaciomarine mud and silt). While the Presumpscot Formation can occur from Kittery to Eastport, the distribution of this surficial sediment is patchy. A surficial geology map will show where the Presumpscot Formation is known to occur along the shoreline. Landslides are much less likely to occur in sand and gravel deposits (glacial till and outwash) that are shown on a surficial geology map. These coarse-grained sediments are still subject to bluff erosion, so using a surficial geology map alongside either a coastal bluffs or landslide hazards map is a good idea when making land-use decisions.
More Information
For more information on Maine landslides, refer to the following pages:
- The April 1996 Rockland Landslide
- Aftermath of the 1996 Rockland Landslide
- Coastal Landslide Hazards
- Maine Landslides
- Maine's Coastal Marine Geology
For further assistance in interpreting this map, contact a geologist at the Maine Geological Survey.
Last updated on April 26, 2012