DACF Home → Bureaus & Programs → Maine Geological Survey → Maps, Publications and Online Data → Using Geologic Maps → Reading Detailed Bedrock Geology Maps
Reading Detailed Bedrock Geology Maps
What's on the maps?
Bedrock, or ledge as it is sometimes called, underlies all parts of the Earth's surface. It is usually buried by soil and vegetation, but in places such as mountain tops, stream banks, and road cuts it is often visible at the ground surface. A bedrock geologic map shows the distribution and arrangement of rock types in an area as if the overlying surficial materials had been stripped away.
Uses of the maps
The information on bedrock maps is generally aimed at a geotechnical or professional geologic audience, and has been interpreted and applied in many ways.
- One of the earliest and still most common uses of bedrock geology maps is to aid a geologist in unravelling the geologic history of a region. The bedrock preserves a record of the geologic events - sedimentation, tectonism, igneous activity and others - that took place in the (sometimes) very distant and (sometimes) very recent past.
- Another use is to identify the distribution of Maine's economically significant mineral resources, such as iron, lead, zinc, copper, nickel, silver, and gold. Exploration geologists or mineral collectors looking for metal ores, industrial minerals, or gemstones may be interested in specific rock types likely to contain the minerals of interest.
- Any significant subsurface activity, such as excavating for building foundations, installing bridge footings or power poles, quarrying gravel, or drilling water wells may encounter bedrock. A bedrock map is the geologist's prediction of what kind of rock will be encountered below the surface based on observed surface exposures.
- Quarries, whether for building stone such as granite or for crushed rock aggregate with particular strength characteristics, are best sited in appropriate rock types. Bedrock maps are useful for siting these quarries.
- Engineers planning roads or transmission line routes may use bedrock maps in conjunction with surficial geologic maps to see where valleys, ridges, and hills are controlled structurally by shallow bedrock rather than by unconsolidated deposits.
- Soil chemistry, important to agriculture and natural plant ecology, is related to bedrock composition because rock weathering contributes to soil formation.
- Information about bedrock faults and fractures is useful when assessing the long-term earthquake hazard to nuclear power and other critical facilities in the northeast.
- With a large proportion of Maine residents drinking water from bedrock wells, understanding the flow and chemistry of water in fractured bedrock and the effect of bedrock composition on water chemistry is becoming increasingly important. Water from wells drilled into bedrock may contain dissolved iron, manganese, calcium, or other undesirable constituents that occur naturally in higher concentrations in some rocks than in others. Groundwater flow in bedrock, relevant to water supply and contaminant transport issues, is controlled in a complicated way by the rock structure, including lithologic layering, metamorphic foliation, folds, dikes, and fractures, any of which may be indicated by symbols on the map.
Definitions
At one level, bedrock maps are relatively simple to read - each distinctive color or pattern represents a different type of rock or a rock type of a different age. At another level, bedrock maps are probably the most difficult maps for the layman to understand. Explanations are often full of technical terminology. Here are some online glossaries that will help to define some of the words you see on these maps:
- Glossary of Geology - GeologyLink
- Glossary of rock, mineral, and gemstone terms - Mineral and Gemstone Kingdom
Tips for Reading the Maps - Geologic Unit Boundaries
What are the colored areas on the map?
Imagine the surface of the Earth with all the vegetation, soil, and man-made structures stripped away. Only the bedrock surface would remain. Each area with a different color or pattern on a bedrock map represents a different rock type or a rock type of a different age (different "geologic units"). The line separating one type of rock from another or rocks of different ages is what geologists call a "contact."
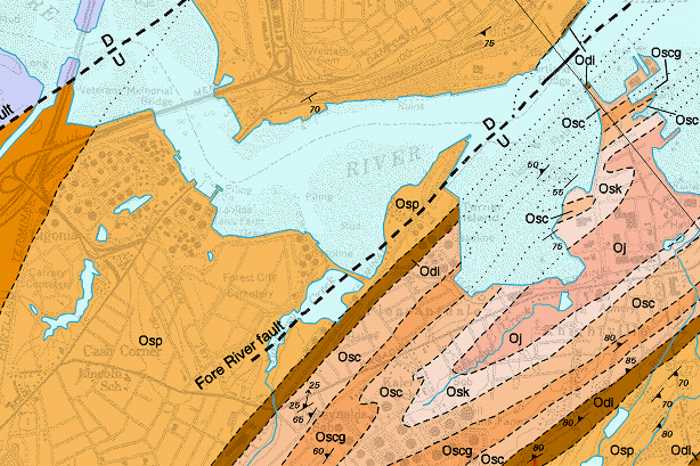
Figure 1. A portion of the bedrock geology map of the Portland West quadrangle.
How accurate are the unit boundaries?
In Maine, because bedrock is generally exposed in less than 5% of any given area, considerable interpretation is required on the part of the geologist when drawing the line separating different geologic units. The geologist gathers information on rock type, mineralogy, and structure at as many bedrock exposures ("outcrops") as possible, plots them on a topographic map, and draws contact lines between the various geologic units. The more observations in an area, the more accurate the position of the geologic contact. The type of line showing the contact may also indicate accuracy (Figure 2; see the question below on "What do the different types of lines represent?").
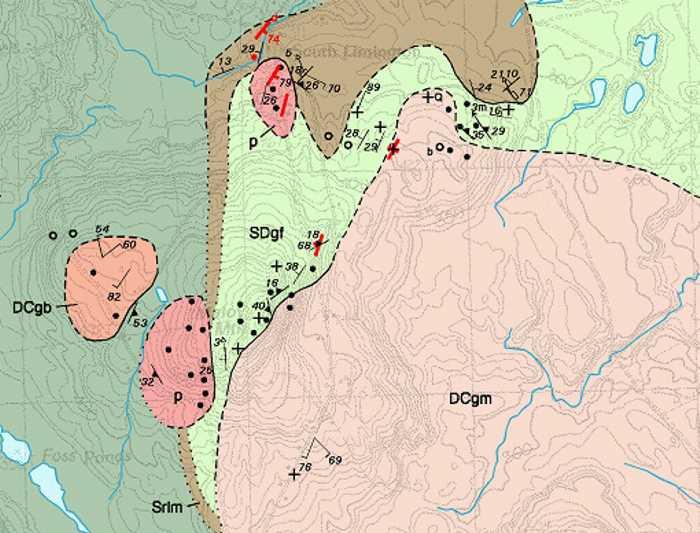
Figure 2. A portion of the bedrock geology map of the Limington quadrangle. Each symbol shown on the map represents an observation at a bedrock outcrop. The more observations in an area, the more accurate the position of the geologic contact. In this example, the type of line representing the contact also indicates accuracy: dotted = inferred; dashed = approximately located; and solid = well located.
How do the rock types extend underground?
The pattern of rocks shown on a bedrock map represents the rock types at the surface. The 3-dimensional structure of the bedrock depends on the shape of the geologic units, their thickness, and their orientation. Part of the geologic mapping process is measuring the orientation of the geologic units. This information is shown in many of the symbols on the map (see the question below on "What do the map symbols represent?"). Using these observations, together with the distribution of geologic units at the surface, a geologist can interpret the 3-dimensional structure.
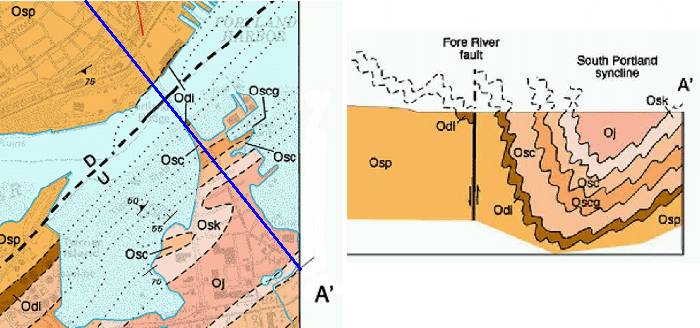
Figure 3. Portion of the Portland West bedrock geology quadrangle. The cross section at right is drawn along the traverse line shown in blue on the map at left. The cross section shows the geologist's schematic interpretation of how the rock layers extend underground.
For an informative, visual interpretation of rock structures, visit GeoBlocks 3D, a structural geology site authored by Steve Reynolds, geology professor at Arizona State University.
Does the pattern of the rock boundaries tell anything about the geologic history of the quad?
The distribution of rock types and rocks of different ages shown on a bedrock map together with the interpretation of the 3-dimensional structure of the bedrock are the key elements in deducing the geologic history of a region. As mentioned above, the bedrock preserves a record of the geologic events that created and modified the geologic units we see (and map) today. They may tell us about a long period of sediment deposition on the floor of ancient ocean, followed by a period of mountain building and erosion, or massive volcanic eruptions and the intrusion of masses of molten igeous rock. By "reading the rocks" to identify these events and their relative ages, the geologist can piece together the geologic history of a region. With the aid of techniques used to determine the absolute ages of geologic units, the geologist can construct the type of geologic history described in the Bedrock Geologic History of Maine.
Tips for Reading the Maps - Map Symbols
What do the geologic unit labels mean?
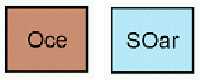
There are two parts to a geologic unit label: the capital letters at the beginning which represent the geologic age; and the lower case letters at the end which represent the geologic unit. The geologic unit is commonly an abbreviation of a "formation" or "member" name. A description of the rock type (sandstone, limestone, granite, basalt) can be found in the map explantion. For example, "Oce" stands for the Ordovician (~440 million years old) Cape Elizabeth Formation, a fine-grained gray schist -- a type of metamorphic rock (Figure 4).
| Stratified Rocks | Intrusive Rocks |
 |
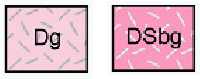 |
Figure 4. Examples of geologic unit labels. Labels for stratified rocks are usually abbreviations of the age and formation of the rock. Oce - Ordovician Cape Elizabeth Formation. SOar - Silurian-Ordovician Appleton Ridge Formation. Labels for intrusive rocks are usually abbreviations of the age and type of rock. Dg - Devonian granite. DSbg - Devonian-Silurian biotite granite.
What do the map symbols represent?
Each map symbol represents an observation at a rock outcrop. So at the most basic level, the symbols give an idea of the extent of exposed bedrock in the quadrangle. Each type of symbol represents a specific type of observation, for example the strike and dip of bedding or foliation, trend and plunge of fold axes and hinges, lineations, and many more. These measurements represent the basic structural data used by the geologist to interpret the location of geologic contacts on the map and the 3-dimensional structure of the bedrock.
The symbols may also represent a rock type too small to show as a discrete geologic unit (for example, an igneous dike or veins of quartz), or the occurrence of a particular mineral (Si - sillimanite or And - andalusite or Ky - kyanite).
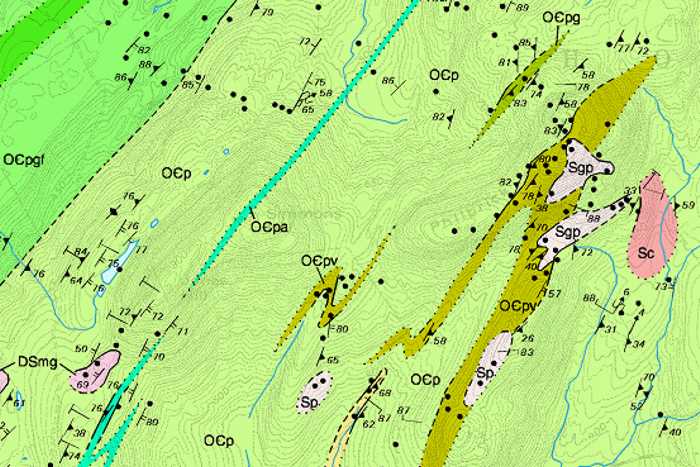
Figure 5. Portion of the bedrock geology map of the Searsmont quadrangle.
What do the different types of lines represent?
The types of lines shown on the map all have different meanings. Some represent the contact between different geologic units; some may represent geologic structures such as faults that may separate geologic units or occur within a geologic unit. In general, each line may be dotted, dashed, or solid. This represents the geologist's confidence in the location of the line: dotted = inferred; dashed = approximately located; and solid = well located. The different line weights and styles on the map represent contacts (the boundary between adjacent rock types); faults (the surface where rocks have fractured and moved against one another); fold hinges (the line of maximum curvature where rocks have been distorted or "folded"), metamorphic isograds (which separate rocks that have buried at different depths and heated to different temperatures), and others.
Tips for Reading the Maps - Map Explanation
How can you translate the unit descriptions?
The system used for naming geologic units on a bedrock map is as old as, well, as old as some of the geologic units themselves... Well, not really, but it dates in part to England of the 17th century. The first true bedrock geologic map dates to this time (refer to Simon Winchester's book entitled The Map that Changed the World: William Smith and the Birth of Modern Geology). The rocks shown on this map were named after the places where they were first recognized or where there were especially good exposures of the rock. This tradition has continued to today - for example the Oce symbol described above.
This can lead to some problems. For example, when two geologists map their way into an area from different directions. In this case the same geologic unit may end up with different names. Most of the time the older name will prevail, but not always. Depending on the level of detail of the mapping (or the level of animosity between the geologists), they may simply agree to disagree and the rock will be called one name in one part of the State and another name in the another part of the State. Or, they may put their heads together and come up with an entirely new name.
There is also a hierarchy of geologic units. The basic geologic unit is a "formation", which is defined as a rock unit with a distinctive appearance -- geologists can tell it apart from surrounding rock units. Formations may contain "members" (subdivisions of the formation rock unit), and may themselves be part of a "group".
As a result, the descriptions of bedrock units in the map explanation can be very complex. Consider the following excerpt from the bedrock geology map of the Portland West quadrangle.
- MERRIMACK GROUP
- Berwick Formation. Fine-grained medium gray migmatized and non-migmatized quartz-plagioclase biotite gneiss and granofels with minor light medium gray calc-silicate gneiss or granofels.
- Eliot Formation. Fine-grained buff-weathering, medium-gray quartz-plagioclase-biotite phyllite with abundant carbonate at lowest grades, calc-silicate minerals (clinozoisite, sphene, diopside, and rarely grossular) at higher grades of metamorphism; with interlayered dark gray phyllite. Formation is strongly sheared throughout.
In layman's terms, you might read the explanation of the Eliot Formation as follows:
Eliot Formation (name of the formation). Fine-grained (rock consists of small mineral grains) buff-weathering (when exposed to weather at the surface, the rock looks buff-colored), medium-gray (if you chipped the surface of the rock, the unweathered surface would be gray) quartz-plagioclase-biotite (the main constituent minerals of the rock) phyllite (a metamorphic rock) with abundant carbonate (contains carbonate minerals) at lowest grades (low degree of metamorphism), calc-silicate minerals (clinozoisite, sphene, diopside, and rarely grossular) (minerals formed during metamorphism) at higher grades of metamorphism (more intense metamorphism); with interlayered dark gray phyllite (contains layers of dark gray phyllite). Formation is strongly sheared throughout (internal structure of the rock is sheared -- caused by metamorphism).
Tips for Reading the Maps - Related Maps
Is there any bedrock information on any other maps published by the Survey?
Depth to bedrock and the location of bedrock outcrops are shown on several other map series. The following map series have this type of information: surficial materials - depth to bedrock and outcrop locations, significant sand and gravel aquifers - depth to bedrock and outcrop locations, bedrock ground-water resources - depth to bedrock from well logs, and surficial geology - outcrop locations.
More Information
For more information on Maine's bedrock geology, refer to the following page:
For further assistance in interpreting this map, contact a geologist at the Maine Geological Survey.
Last updated on February 29, 2016