DACF Home → Bureaus & Programs → Maine Geological Survey → Hazards → Maine Coastal Elevation and Flood Level Tool
Maine Coastal Elevation and Flood Level Tool
Viewer Instructions
- Zoom in on the area of interest to view flood information
- Select the layers menu to view different available layers
- Click on pink contours to view elevations of the ground surface, mean lower low water (MLLW), highest astronomical tide (HAT), FEMA Base Flood Elevation, and the FEMA flood zone designation
What can this viewer be used for?
- Determine the FEMA flood hazard designation in a location
- View a location’s elevation relative to three commonly-described coastal water levels: mean lower low water (MLLW), highest astronomical tide (HAT), and FEMA base flood elevation (BFE)
- Convert between the MLLW and NAVD88 vertical datums
How do I interpret the information in this viewer?
Two types of information are available on this viewer.
- FEMA Flood Hazard Zones (turquoise polygons): These show the areas that would likely be flooded by the present-day or recent historical 1% annual chance flood event, including the combined impacts of tides, storm surge, and waves. Note that:
- FEMA flood maps represent flood hazard for as specific time period and do not provide information about time-evolving flood hazard due to sea level rise. In other words, they assume sea level is what it was over some recent time period, depending on when the maps were developed. York and Cumberland County map flood hazard for 2017 sea level (only about 0.1 feet lower than mid-2020s sea level) . Sagadahoc through Washington counties map flood hazard for 1983-2001 sea level (about 0.5 feet lower than mid-2020s sea level). Note that although FEMA base flood elevations are always shown relative to NAVD88, they still must assume a certain baseline sea level that is tied to a specific time period.
- The number in parentheses with the letters “EL” – for example “(EL 10)” – is FEMA’s base flood elevation in feet above the NAVD88 vertical datum. This is the peak water surface elevation reached by the 1% annual chance flood event.
- Flood zones are designated as VE zones (vulnerable to damaging waves greater than or equal to 3 feet) or AE zones (waves less than 3 feet).
- Ground tidal, and Flood Elevation Conversions (pink contour lines): Contour lines show the ground’s elevation in feet above NAVD88 (a land-based “zero” from which elevations are measured). Click on the lines to view the ground’s elevation relative to:
- FEMA Base Flood Elevation (BFE) = peak water surface elevation reached by the present-day or recent historical 1% annual chance flood event, as estimated by FEMA
- Highest Astronomical Tide (HAT) = the highest predicted astronomical tide (the water level from only the tide, without any influence from weather) that is expected to occur at a location, assuming sea level equals the average sea level from 1983-2001 (roughly 0.5 ft lower than mid-2020s sea level). HAT has been exceeded 1 to 10 timers per year over the past decade.
- Mean Lower Low Water (MLLW) = the average of daily lower low water heights over 1983-2001. Water levels, including tide predictions and flood forecasts, are generally provided relative to MLLW (in other words, with MLLW as the “zero”)
Note: AE zones are sometimes separated into Coastal A zones and A zones by a line called the Limit of Moderate Wave Action (LiMWA; shown as black line). Wave heights are between 1.5 and 3 feet on Coastal A-Zones (seaward of the LiMWA) and less than 1.5 feet in AE Zones (landward of the LiMWA or in AE Zones with no LiMWA defined). FEMA developed the LiMWA because waves greater than 1.5 feet can cause damage to infrastructure and recommends that construction in Coastal A Zones follow V-zone design and construction standards.
Data Disclaimer
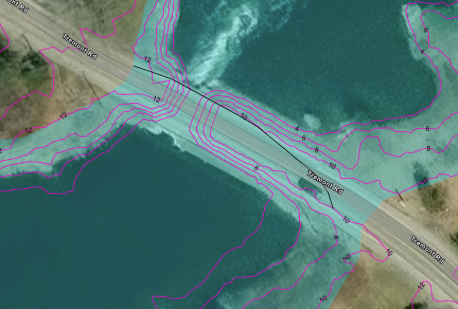
Piers, wharfs, and bridge spans along the coast are often not included in the underlying digital elevation model, so nearby elevation contours may suggest that these structures are below the level of high tide when this is not the case. See the following example from Clark Bridge in Tremont:
These data are meant to help inform decisions at the local, regional, and state-level. Users must assume responsibility in determining the usability of this data for their purposes. Metadata is included for all of the downloadable layers and should be reviewed for more specifics on how these data were created. Neither the Maine Geological Survey; Gulf of Maine Research Institute; the Department of Agriculture, Conservation and Forestry; nor its employees or agents: (1) make any warranty, either expressed or implied for merchantability or fitness for a particular purpose, as to the accuracy or reliability of the information shown on the map; nor are they (2) liable for any damages, including consequential damages, from using the map or the inability to use the map.
Video Tutorial
Data Download
The Coastal Elevation and Flood Level layers can be downloaded as shapefiles for use in any GIS software to perform further spatial analysis.
Analysis Data Sources
- The 1- and 2-meter resolution lidar digital elevation models (DEM) from the Maine GeoLibrary were used as the elevation source for developing the dataset.
- The FEMA National Flood Hazard Layers (NFHL) displayed in the map are sourced directly from FEMA NFHL web services. These layers are updated by FEMA as Flood Insurance Rate Maps (FIRM) are published.
- The NAVD88/MLLW conversion was determined by interpolating the 500 meter-resolution gridded output from VDatum onto elevation contours
- HAT values match the Maine Geological Survey Highest Astronomical Tide Line resource (review the methods).
Citations
Recommended citations for the project, web application, and datasets:
- Project
- Web Application
- Data
More Help
Contact the Maine Geological Survey with questions at: mgs@maine.gov