DACF Home → Bureaus & Programs → Maine Geological Survey → Explore Maine Geology → Coastal Marine Geology → Saco Bay Beach Morphology → Appendix A → Region 3-3
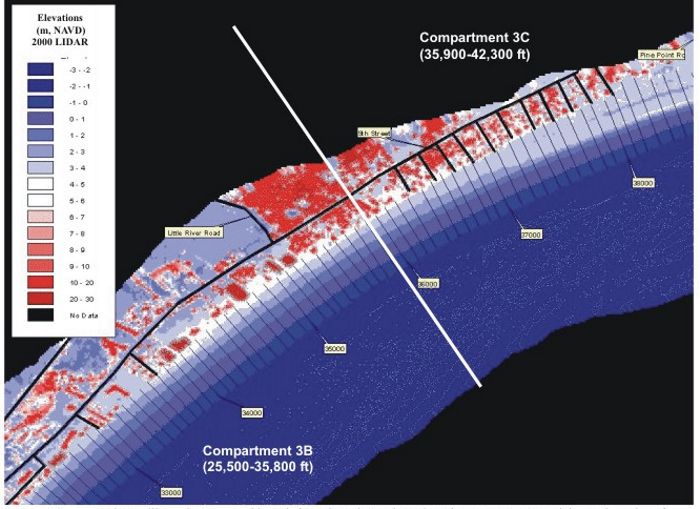
Region 3-3. LIDAR image illustrating topographic variations along the north portion of compartment 3B and the south portion of compartment 3C. LIDAR elevations shown are in meters (NAVD88) and include buildings and trees. Numbers along the shoreline indicate distances alongshore from the south (in ft) used in the report. Black lines represent 100-foot transects used for topographic analysis.
Last updated on January 10, 2006.