ArrayApril 2, 2013 at 1:39 pm
[caption id="attachment_1010" align="alignleft" width="240"]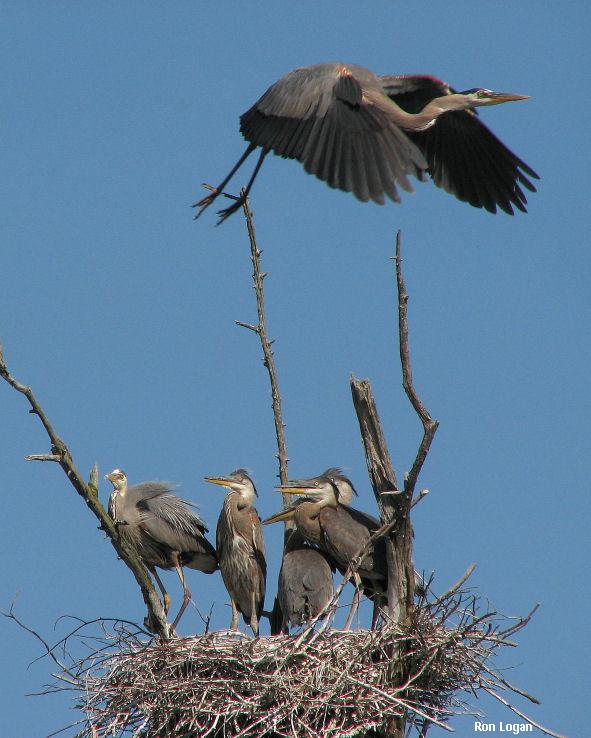 Adult great blue heron in flight over a nest with five young. Photo by Ron Logan.[/caption]
In its fourth year, the Heron Observation Network of Maine continued to provide extremely useful information regarding Maine’s great blue heron breeding population. In 2012, over 46 volunteers and biologists monitored 122 great blue heron colonies across the state. We collectively made at least 170 observations from the ground, and 38 observations from the air. Volunteers who tracked their time reported over 250 hours, which we can use as match for partial funding for our next big aerial survey effort in 2015. THANK YOU to everyone involved!
While the HERON program is not designed to produce a reliable estimate of the great blue heron breeding population, or even a scientifically defendable trend, it does provide useful information that can help paint a picture of what might be occurring on a statewide basis. Overall, the results still indicate a drop in the coastal breeding population and a potential drop in numbers at inland colonies as well.
One of the challenges with the HERON data is that it does not include every heron colony in the state nor does it reflect a random sample of the colonies. The colonies surveyed are ones that willing volunteers and biologists can easily get to! With limited time and resources, we will never be able to survey every historic and current colony in the state in one season. We now have over 295 sites in our database that have hosted nesting great blue herons in recent or historic times. New colonies are found each year, which indicates we are likely missing some, too. Colonies may persist for decades, but they also may blink on and off, or splinter into several small colonies. This dynamic nature of heron nesting ecology adds to the challenge of obtaining an accurate count of breeding pairs in any given year.
So, what does the monitoring data indicate? Many of the colonies that have been “adopted” by volunteers have been surveyed in all of the last 4 years. You might expect that those colonies would follow a similar trend to the entire statewide collection of colonies. You also might expect that for sites that were monitored in only 1 or 2 of the last 4 years, the latest information for that site may still hold true. Using the best available data that we have, we can show what we know and realize that the information has limitations.
[caption id="attachment_1018" align="alignleft" width="300"]
Adult great blue heron in flight over a nest with five young. Photo by Ron Logan.[/caption]
In its fourth year, the Heron Observation Network of Maine continued to provide extremely useful information regarding Maine’s great blue heron breeding population. In 2012, over 46 volunteers and biologists monitored 122 great blue heron colonies across the state. We collectively made at least 170 observations from the ground, and 38 observations from the air. Volunteers who tracked their time reported over 250 hours, which we can use as match for partial funding for our next big aerial survey effort in 2015. THANK YOU to everyone involved!
While the HERON program is not designed to produce a reliable estimate of the great blue heron breeding population, or even a scientifically defendable trend, it does provide useful information that can help paint a picture of what might be occurring on a statewide basis. Overall, the results still indicate a drop in the coastal breeding population and a potential drop in numbers at inland colonies as well.
One of the challenges with the HERON data is that it does not include every heron colony in the state nor does it reflect a random sample of the colonies. The colonies surveyed are ones that willing volunteers and biologists can easily get to! With limited time and resources, we will never be able to survey every historic and current colony in the state in one season. We now have over 295 sites in our database that have hosted nesting great blue herons in recent or historic times. New colonies are found each year, which indicates we are likely missing some, too. Colonies may persist for decades, but they also may blink on and off, or splinter into several small colonies. This dynamic nature of heron nesting ecology adds to the challenge of obtaining an accurate count of breeding pairs in any given year.
So, what does the monitoring data indicate? Many of the colonies that have been “adopted” by volunteers have been surveyed in all of the last 4 years. You might expect that those colonies would follow a similar trend to the entire statewide collection of colonies. You also might expect that for sites that were monitored in only 1 or 2 of the last 4 years, the latest information for that site may still hold true. Using the best available data that we have, we can show what we know and realize that the information has limitations.
[caption id="attachment_1018" align="alignleft" width="300"]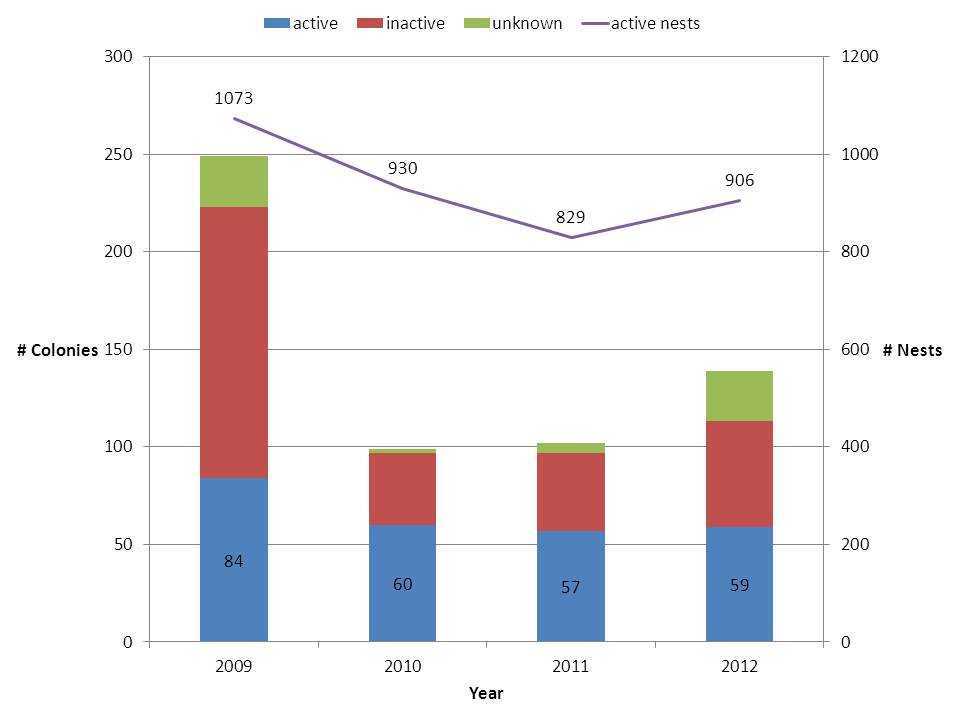 Figure 1. Great blue heron activity observed at known colonies.[/caption]
Figure 1 shows heron colony activity observations for each year. There are certainly gaps in the data represented here. The same colonies were not observed each year. The 2010-2012 data includes new colonies found each of those years that had not been surveyed in years prior. Even though some colonies may have become inactive, new colonies were also being added to the list. Despite both additions and subtractions, the number of pairs appeared to decrease from 2009 to 2011 and then slightly increase again in 2012. But, remember, there are many colonies that did not get looked at each of those years, so it is not a complete picture.
[caption id="attachment_1017" align="alignleft" width="300"]
Figure 1. Great blue heron activity observed at known colonies.[/caption]
Figure 1 shows heron colony activity observations for each year. There are certainly gaps in the data represented here. The same colonies were not observed each year. The 2010-2012 data includes new colonies found each of those years that had not been surveyed in years prior. Even though some colonies may have become inactive, new colonies were also being added to the list. Despite both additions and subtractions, the number of pairs appeared to decrease from 2009 to 2011 and then slightly increase again in 2012. But, remember, there are many colonies that did not get looked at each of those years, so it is not a complete picture.
[caption id="attachment_1017" align="alignleft" width="300"] Figure 2. Great blue heron activity at known colonies, using most recent data to fill in gaps.[/caption]
Figure 2 shows the same data as Figure 1, but I’ve added in the most recent data (collected 2009 or later) to 2010, 2011, and 2012 data. This may give a more complete picture, and as you can see the line actually jumped a bit in 2010, but overall looks somewhat stable with an average of 1,070 nesting pairs each year.
[caption id="attachment_1016" align="alignright" width="300"]
Figure 2. Great blue heron activity at known colonies, using most recent data to fill in gaps.[/caption]
Figure 2 shows the same data as Figure 1, but I’ve added in the most recent data (collected 2009 or later) to 2010, 2011, and 2012 data. This may give a more complete picture, and as you can see the line actually jumped a bit in 2010, but overall looks somewhat stable with an average of 1,070 nesting pairs each year.
[caption id="attachment_1016" align="alignright" width="300"]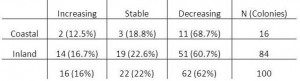 Figure 3. Trend in # of nests at colonies observed at least twice between 2009 and 2012.[/caption]
In addition to looking at the collective sum of colonies and pairs statewide, we can look at what’s happening within colonies. Are the number of nesting pairs at each colony increasing, decreasing, or staying the same? For any colony with 2 or more years of observations within the last 4 years, I determined the trend in nesting pairs. There were 100 colonies for which I was able to do this, and 62 of those (62%) showed a decreasing trend in number of nesting pairs (Figure 3). Even when sites are split into coastal and inland categories, the trend remains the same. This is interesting to me because we have good data that shows a clear decline among coastal sites since the mid-1980s, but have yet to detect a trend for inland sites. While this doesn’t definitively tell us there is a decline occurring at inland sites statewide, it may hint at it.
In 2012, we started tracking productivity at a subset of great blue heron colonies. The best way to measure productivity is to know the number of eggs laid and the number of young that fledge for each nest. However, because nests are high above the ground, we do not know how many eggs are laid by each pair, so instead we use the number of hatchlings as our starting parameter. It is also difficult to document fledging of young because it happens over a relatively long period, and observers are not watching the colonies continuously. Instead we use the number of young that reach an age close to fledging, or 5-8 weeks. By tracking the status of individual nests and recording the number of hatchlings and number of young that survive to pre-fledging age (5-8 weeks old), we can get a measure of reproductive success by nest and for each colony.
[caption id="attachment_1015" align="alignleft" width="225"]
Figure 3. Trend in # of nests at colonies observed at least twice between 2009 and 2012.[/caption]
In addition to looking at the collective sum of colonies and pairs statewide, we can look at what’s happening within colonies. Are the number of nesting pairs at each colony increasing, decreasing, or staying the same? For any colony with 2 or more years of observations within the last 4 years, I determined the trend in nesting pairs. There were 100 colonies for which I was able to do this, and 62 of those (62%) showed a decreasing trend in number of nesting pairs (Figure 3). Even when sites are split into coastal and inland categories, the trend remains the same. This is interesting to me because we have good data that shows a clear decline among coastal sites since the mid-1980s, but have yet to detect a trend for inland sites. While this doesn’t definitively tell us there is a decline occurring at inland sites statewide, it may hint at it.
In 2012, we started tracking productivity at a subset of great blue heron colonies. The best way to measure productivity is to know the number of eggs laid and the number of young that fledge for each nest. However, because nests are high above the ground, we do not know how many eggs are laid by each pair, so instead we use the number of hatchlings as our starting parameter. It is also difficult to document fledging of young because it happens over a relatively long period, and observers are not watching the colonies continuously. Instead we use the number of young that reach an age close to fledging, or 5-8 weeks. By tracking the status of individual nests and recording the number of hatchlings and number of young that survive to pre-fledging age (5-8 weeks old), we can get a measure of reproductive success by nest and for each colony.
[caption id="attachment_1015" align="alignleft" width="225"]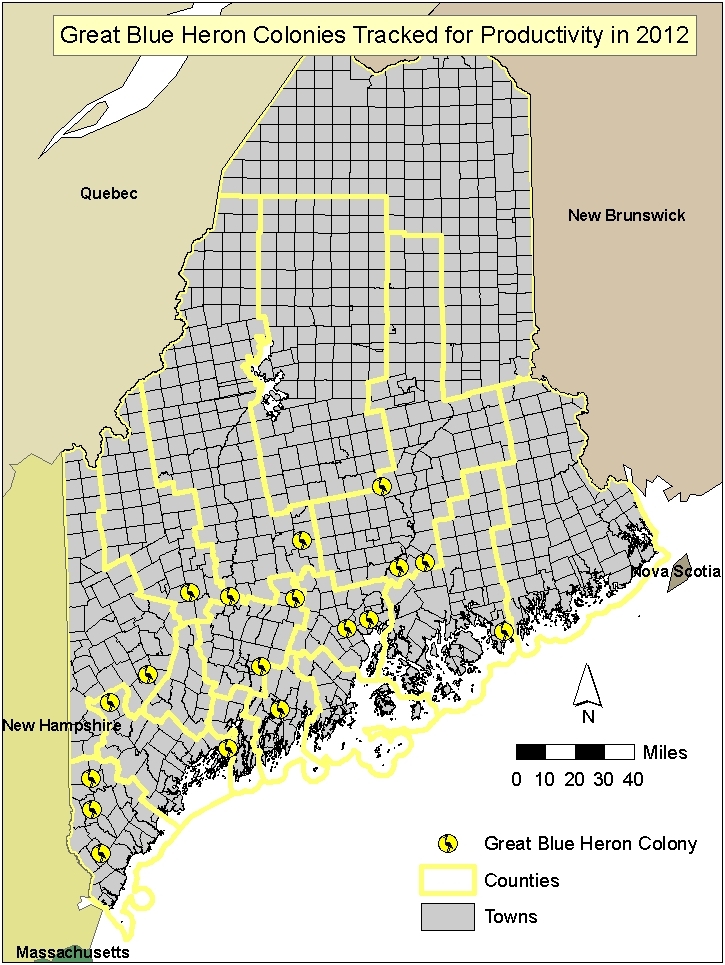 Figure 4. Volunteers and biologists tracked productivity at individual nests within 18 colonies across the state in 2012.[/caption]
Volunteers and biologists collected productivity data for 18 colonies in 2012 (Figure 4). The average number of hatchlings seen in nests was 2.53 per nest; and the average number of young that reached pre-fledging age was 1.86 per nest. The average success rate for colonies (% of young that made it to pre-fledging age) was 70.2%. It is difficult to compare our rates to those found in the literature because methods vary subtly among studies. However, this year’s effort was a start to understanding great blue heron productivity rates in Maine and will help us design meaningful studies in the future. Over time, productivity measures can help determine the effects of land use changes, document effects of contaminants or diseases, and measure whether a population is reproducing well enough to sustain itself, given existing rates of survival.
So where do we go from here? We obviously need more data! My plan is to continue collecting data the way we’ve been doing so the past 4 years, but to also do a statewide aerial survey in 2015 that will “sample” the state in a manner that we can develop a population estimate. The data collected via HERON will feed into the survey design and help us determine detectability of colonies. For example, if we miss a “known” colony in 2015, then we can determine the percentage we missed and extrapolate from there. My point is: we need to keep the data coming. We need to know about all colonies, and we need more volunteers out on the ground observing colonies.
If you or someone you know may be interested in joining the Heron Observation Network or would like to report a colony, please contact Danielle D’Auria, 941-4478, danielle.dauria@maine.gov.
Figure 4. Volunteers and biologists tracked productivity at individual nests within 18 colonies across the state in 2012.[/caption]
Volunteers and biologists collected productivity data for 18 colonies in 2012 (Figure 4). The average number of hatchlings seen in nests was 2.53 per nest; and the average number of young that reached pre-fledging age was 1.86 per nest. The average success rate for colonies (% of young that made it to pre-fledging age) was 70.2%. It is difficult to compare our rates to those found in the literature because methods vary subtly among studies. However, this year’s effort was a start to understanding great blue heron productivity rates in Maine and will help us design meaningful studies in the future. Over time, productivity measures can help determine the effects of land use changes, document effects of contaminants or diseases, and measure whether a population is reproducing well enough to sustain itself, given existing rates of survival.
So where do we go from here? We obviously need more data! My plan is to continue collecting data the way we’ve been doing so the past 4 years, but to also do a statewide aerial survey in 2015 that will “sample” the state in a manner that we can develop a population estimate. The data collected via HERON will feed into the survey design and help us determine detectability of colonies. For example, if we miss a “known” colony in 2015, then we can determine the percentage we missed and extrapolate from there. My point is: we need to keep the data coming. We need to know about all colonies, and we need more volunteers out on the ground observing colonies.
If you or someone you know may be interested in joining the Heron Observation Network or would like to report a colony, please contact Danielle D’Auria, 941-4478, danielle.dauria@maine.gov.
 Adult great blue heron in flight over a nest with five young. Photo by Ron Logan.[/caption]
In its fourth year, the Heron Observation Network of Maine continued to provide extremely useful information regarding Maine’s great blue heron breeding population. In 2012, over 46 volunteers and biologists monitored 122 great blue heron colonies across the state. We collectively made at least 170 observations from the ground, and 38 observations from the air. Volunteers who tracked their time reported over 250 hours, which we can use as match for partial funding for our next big aerial survey effort in 2015. THANK YOU to everyone involved!
While the HERON program is not designed to produce a reliable estimate of the great blue heron breeding population, or even a scientifically defendable trend, it does provide useful information that can help paint a picture of what might be occurring on a statewide basis. Overall, the results still indicate a drop in the coastal breeding population and a potential drop in numbers at inland colonies as well.
One of the challenges with the HERON data is that it does not include every heron colony in the state nor does it reflect a random sample of the colonies. The colonies surveyed are ones that willing volunteers and biologists can easily get to! With limited time and resources, we will never be able to survey every historic and current colony in the state in one season. We now have over 295 sites in our database that have hosted nesting great blue herons in recent or historic times. New colonies are found each year, which indicates we are likely missing some, too. Colonies may persist for decades, but they also may blink on and off, or splinter into several small colonies. This dynamic nature of heron nesting ecology adds to the challenge of obtaining an accurate count of breeding pairs in any given year.
So, what does the monitoring data indicate? Many of the colonies that have been “adopted” by volunteers have been surveyed in all of the last 4 years. You might expect that those colonies would follow a similar trend to the entire statewide collection of colonies. You also might expect that for sites that were monitored in only 1 or 2 of the last 4 years, the latest information for that site may still hold true. Using the best available data that we have, we can show what we know and realize that the information has limitations.
[caption id="attachment_1018" align="alignleft" width="300"]
Adult great blue heron in flight over a nest with five young. Photo by Ron Logan.[/caption]
In its fourth year, the Heron Observation Network of Maine continued to provide extremely useful information regarding Maine’s great blue heron breeding population. In 2012, over 46 volunteers and biologists monitored 122 great blue heron colonies across the state. We collectively made at least 170 observations from the ground, and 38 observations from the air. Volunteers who tracked their time reported over 250 hours, which we can use as match for partial funding for our next big aerial survey effort in 2015. THANK YOU to everyone involved!
While the HERON program is not designed to produce a reliable estimate of the great blue heron breeding population, or even a scientifically defendable trend, it does provide useful information that can help paint a picture of what might be occurring on a statewide basis. Overall, the results still indicate a drop in the coastal breeding population and a potential drop in numbers at inland colonies as well.
One of the challenges with the HERON data is that it does not include every heron colony in the state nor does it reflect a random sample of the colonies. The colonies surveyed are ones that willing volunteers and biologists can easily get to! With limited time and resources, we will never be able to survey every historic and current colony in the state in one season. We now have over 295 sites in our database that have hosted nesting great blue herons in recent or historic times. New colonies are found each year, which indicates we are likely missing some, too. Colonies may persist for decades, but they also may blink on and off, or splinter into several small colonies. This dynamic nature of heron nesting ecology adds to the challenge of obtaining an accurate count of breeding pairs in any given year.
So, what does the monitoring data indicate? Many of the colonies that have been “adopted” by volunteers have been surveyed in all of the last 4 years. You might expect that those colonies would follow a similar trend to the entire statewide collection of colonies. You also might expect that for sites that were monitored in only 1 or 2 of the last 4 years, the latest information for that site may still hold true. Using the best available data that we have, we can show what we know and realize that the information has limitations.
[caption id="attachment_1018" align="alignleft" width="300"] Figure 1. Great blue heron activity observed at known colonies.[/caption]
Figure 1 shows heron colony activity observations for each year. There are certainly gaps in the data represented here. The same colonies were not observed each year. The 2010-2012 data includes new colonies found each of those years that had not been surveyed in years prior. Even though some colonies may have become inactive, new colonies were also being added to the list. Despite both additions and subtractions, the number of pairs appeared to decrease from 2009 to 2011 and then slightly increase again in 2012. But, remember, there are many colonies that did not get looked at each of those years, so it is not a complete picture.
[caption id="attachment_1017" align="alignleft" width="300"]
Figure 1. Great blue heron activity observed at known colonies.[/caption]
Figure 1 shows heron colony activity observations for each year. There are certainly gaps in the data represented here. The same colonies were not observed each year. The 2010-2012 data includes new colonies found each of those years that had not been surveyed in years prior. Even though some colonies may have become inactive, new colonies were also being added to the list. Despite both additions and subtractions, the number of pairs appeared to decrease from 2009 to 2011 and then slightly increase again in 2012. But, remember, there are many colonies that did not get looked at each of those years, so it is not a complete picture.
[caption id="attachment_1017" align="alignleft" width="300"]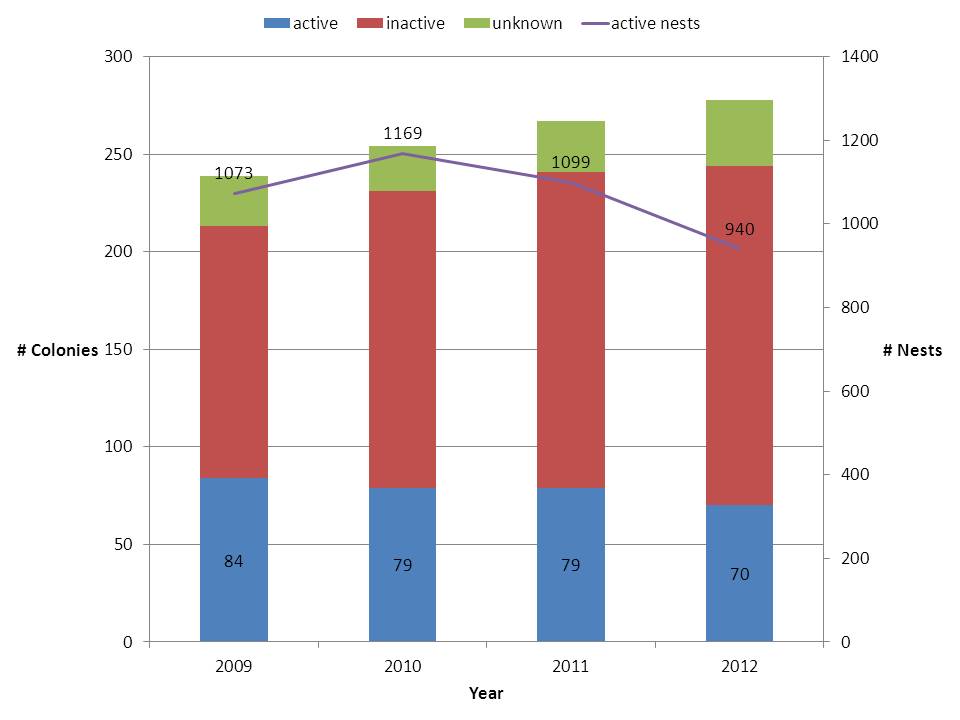 Figure 2. Great blue heron activity at known colonies, using most recent data to fill in gaps.[/caption]
Figure 2 shows the same data as Figure 1, but I’ve added in the most recent data (collected 2009 or later) to 2010, 2011, and 2012 data. This may give a more complete picture, and as you can see the line actually jumped a bit in 2010, but overall looks somewhat stable with an average of 1,070 nesting pairs each year.
[caption id="attachment_1016" align="alignright" width="300"]
Figure 2. Great blue heron activity at known colonies, using most recent data to fill in gaps.[/caption]
Figure 2 shows the same data as Figure 1, but I’ve added in the most recent data (collected 2009 or later) to 2010, 2011, and 2012 data. This may give a more complete picture, and as you can see the line actually jumped a bit in 2010, but overall looks somewhat stable with an average of 1,070 nesting pairs each year.
[caption id="attachment_1016" align="alignright" width="300"]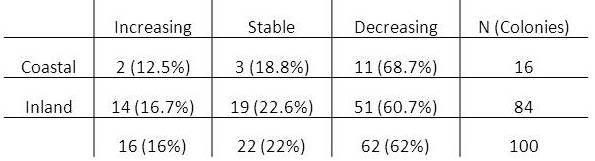 Figure 3. Trend in # of nests at colonies observed at least twice between 2009 and 2012.[/caption]
In addition to looking at the collective sum of colonies and pairs statewide, we can look at what’s happening within colonies. Are the number of nesting pairs at each colony increasing, decreasing, or staying the same? For any colony with 2 or more years of observations within the last 4 years, I determined the trend in nesting pairs. There were 100 colonies for which I was able to do this, and 62 of those (62%) showed a decreasing trend in number of nesting pairs (Figure 3). Even when sites are split into coastal and inland categories, the trend remains the same. This is interesting to me because we have good data that shows a clear decline among coastal sites since the mid-1980s, but have yet to detect a trend for inland sites. While this doesn’t definitively tell us there is a decline occurring at inland sites statewide, it may hint at it.
In 2012, we started tracking productivity at a subset of great blue heron colonies. The best way to measure productivity is to know the number of eggs laid and the number of young that fledge for each nest. However, because nests are high above the ground, we do not know how many eggs are laid by each pair, so instead we use the number of hatchlings as our starting parameter. It is also difficult to document fledging of young because it happens over a relatively long period, and observers are not watching the colonies continuously. Instead we use the number of young that reach an age close to fledging, or 5-8 weeks. By tracking the status of individual nests and recording the number of hatchlings and number of young that survive to pre-fledging age (5-8 weeks old), we can get a measure of reproductive success by nest and for each colony.
[caption id="attachment_1015" align="alignleft" width="225"]
Figure 3. Trend in # of nests at colonies observed at least twice between 2009 and 2012.[/caption]
In addition to looking at the collective sum of colonies and pairs statewide, we can look at what’s happening within colonies. Are the number of nesting pairs at each colony increasing, decreasing, or staying the same? For any colony with 2 or more years of observations within the last 4 years, I determined the trend in nesting pairs. There were 100 colonies for which I was able to do this, and 62 of those (62%) showed a decreasing trend in number of nesting pairs (Figure 3). Even when sites are split into coastal and inland categories, the trend remains the same. This is interesting to me because we have good data that shows a clear decline among coastal sites since the mid-1980s, but have yet to detect a trend for inland sites. While this doesn’t definitively tell us there is a decline occurring at inland sites statewide, it may hint at it.
In 2012, we started tracking productivity at a subset of great blue heron colonies. The best way to measure productivity is to know the number of eggs laid and the number of young that fledge for each nest. However, because nests are high above the ground, we do not know how many eggs are laid by each pair, so instead we use the number of hatchlings as our starting parameter. It is also difficult to document fledging of young because it happens over a relatively long period, and observers are not watching the colonies continuously. Instead we use the number of young that reach an age close to fledging, or 5-8 weeks. By tracking the status of individual nests and recording the number of hatchlings and number of young that survive to pre-fledging age (5-8 weeks old), we can get a measure of reproductive success by nest and for each colony.
[caption id="attachment_1015" align="alignleft" width="225"] Figure 4. Volunteers and biologists tracked productivity at individual nests within 18 colonies across the state in 2012.[/caption]
Volunteers and biologists collected productivity data for 18 colonies in 2012 (Figure 4). The average number of hatchlings seen in nests was 2.53 per nest; and the average number of young that reached pre-fledging age was 1.86 per nest. The average success rate for colonies (% of young that made it to pre-fledging age) was 70.2%. It is difficult to compare our rates to those found in the literature because methods vary subtly among studies. However, this year’s effort was a start to understanding great blue heron productivity rates in Maine and will help us design meaningful studies in the future. Over time, productivity measures can help determine the effects of land use changes, document effects of contaminants or diseases, and measure whether a population is reproducing well enough to sustain itself, given existing rates of survival.
So where do we go from here? We obviously need more data! My plan is to continue collecting data the way we’ve been doing so the past 4 years, but to also do a statewide aerial survey in 2015 that will “sample” the state in a manner that we can develop a population estimate. The data collected via HERON will feed into the survey design and help us determine detectability of colonies. For example, if we miss a “known” colony in 2015, then we can determine the percentage we missed and extrapolate from there. My point is: we need to keep the data coming. We need to know about all colonies, and we need more volunteers out on the ground observing colonies.
If you or someone you know may be interested in joining the Heron Observation Network or would like to report a colony, please contact Danielle D’Auria, 941-4478, danielle.dauria@maine.gov.
Figure 4. Volunteers and biologists tracked productivity at individual nests within 18 colonies across the state in 2012.[/caption]
Volunteers and biologists collected productivity data for 18 colonies in 2012 (Figure 4). The average number of hatchlings seen in nests was 2.53 per nest; and the average number of young that reached pre-fledging age was 1.86 per nest. The average success rate for colonies (% of young that made it to pre-fledging age) was 70.2%. It is difficult to compare our rates to those found in the literature because methods vary subtly among studies. However, this year’s effort was a start to understanding great blue heron productivity rates in Maine and will help us design meaningful studies in the future. Over time, productivity measures can help determine the effects of land use changes, document effects of contaminants or diseases, and measure whether a population is reproducing well enough to sustain itself, given existing rates of survival.
So where do we go from here? We obviously need more data! My plan is to continue collecting data the way we’ve been doing so the past 4 years, but to also do a statewide aerial survey in 2015 that will “sample” the state in a manner that we can develop a population estimate. The data collected via HERON will feed into the survey design and help us determine detectability of colonies. For example, if we miss a “known” colony in 2015, then we can determine the percentage we missed and extrapolate from there. My point is: we need to keep the data coming. We need to know about all colonies, and we need more volunteers out on the ground observing colonies.
If you or someone you know may be interested in joining the Heron Observation Network or would like to report a colony, please contact Danielle D’Auria, 941-4478, danielle.dauria@maine.gov.Categories