Home → Spills & Site Cleanup → Programs → Emergency & Spill Response → Marine Oil Spills → Environmental Resources at Risk
Environmental Vulnerability Index | Environmental Sensitivity Index
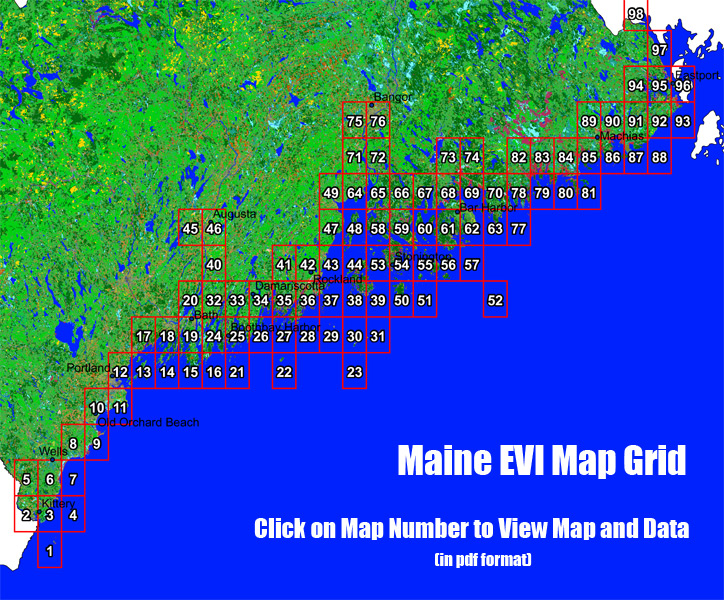
Maine Environmental Vulnerability Index Maps
Maine's Environmental Vulnerability Index maps emerged in response to 1991 PL Chapter 454, An Act to Improve Marine Oil Spill Prevention, Planning, and Response, and 1991 Chapter 698, An Act to Amend the State’s Oil Spill Prevention and Response Provisions. EVI maps depict the environmental, biological, geological, and human resources along the coast of Maine most at risk from oil spilled into a marine or estuarine environment. It is important to note that the maps are not an exhaustive inventory of marine and estuarine species, but are a survey meant to give first responders a tool for prioritizing and targeting protection strategies. The index is a critical component underlying the state's coastal Geographic Response Strategies.
Use the grid index below to view individual EVI maps. Each pdf file contains the map, as well as one to three additional pages of data. Files are 2 - 4 MB, so they may take a few moments to load. Use your browser's "Back" button to return to this page. The maps, data, and accompanying information are formatted to print on 11 x 17 paper. Additional information may be found in the following pdf files:
EVI introduction and specific information about data on the maps
Download entire EVI atlases (Volumes 1 - 4)
To print an entire EVI atlas, use the links below and print double sided on 11x17 paper.
Volume 1: Kittery to Georgetown, Maps 1-20 (89 MB pdf file)
Volume 2: Georgetown to Vinalhaven, Maps 21-49 (101 MB pdf file)
Volume 3: Isle au Haut to Gouldsboro, Maps 50-76 (112 MB pdf file)
Volume 4: Gouldsboro to Calais, Maps 77-98 (83 MB pdf file)
Questions and comments on the EVIs are welcome.
Environmental Sensitivity Index Maps
The state also uses NOAA's Environmental Sensitivity Index Maps (ESIs). ESIs were most recently developed for Maine and New Hampshire in 2016 by NOAA's Office of Response and Restoration. These maps provide a summary of biological, geological and human use resources that are at risk if an oil spill occurs nearby and are integrated into NOAA's Environmental Response Management Application (ERMA) spill modeling app.
On a PC, ESIs can be best viewed by downloading a zip file of PDFs (219 MB) from the NOAA website and opening the Index map. This zip file contains the legend and other supporting data. Alternatively, the ESIs can be viewed on the web through NOAA's ERMA app.