DACF Home → Bureaus & Programs → Maine Geological Survey → Explore Maine Geology → Ground Water and Wells → Water Resources
Water Resources in Maine
Some Water Facts
Average annual rainfall: 42 inches1. Equivalent to 73,500,000 acre-feet or 24 trillion gallons2.
Run-off: About 50% of precipitation, or about 12 trillion gallons, runs off the landscape in streams and rivers3.
Evaporation/transpiration: About 30-40% of rainfall evaporates or is transpired through vegetation3,5. This equals about 7-10 trillion gallons.
Infiltration to groundwater: About 10-20% of precipitation infiltrates to recharge groundwater3. This is about 2-5 trillion gallons annually.
Mapped sand and gravel aquifers occupy about 1,300 sq. mi. of Maine's landscape4. Average annual recharge to these aquifers is about 240 billion gallons.
About 50% of Maine's citizens use a private groundwater well for their household water supply.
Groundwater and surface water are linked. Groundwater constantly flows out to surface water, allowing most streams to flow even during the driest periods.
In 2003, about 13 trillion gallons of water flowed through the Kennebec River at North Sidney5.
Portland Water District, Maine's largest public water supply, serves 200,000 people with about 8.5 billion gallons annually6 (about 10 inches of Sebago Lake water).
Aquifers
Groundwater occurs in Maine in two primary kinds of aquifers, (1) sand and gravel, and (2) bedrock.
Sand and gravel aquifers
These are unconsolidated sand and gravel deposits, most of which were deposited during the last glacial episode which ended about 14,000 - 11,000 years ago in Maine. These deposits have excellent porosity (spaces between grains) and permeability (connection of spaces) that make them significant groundwater resources in the state (Figure 1).

Figure 1. Types of aquifers and wells.
Because they formed as water melted from the glaciers, they are only found in limited areas around the state (Figure 2). Even though some sand and gravel aquifers are very long and thin, they are recharged locally by precipitation. While the deposits can extend for miles, the usage of groundwater only affects the water table locally. These make excellent groundwater sources for towns or industries.
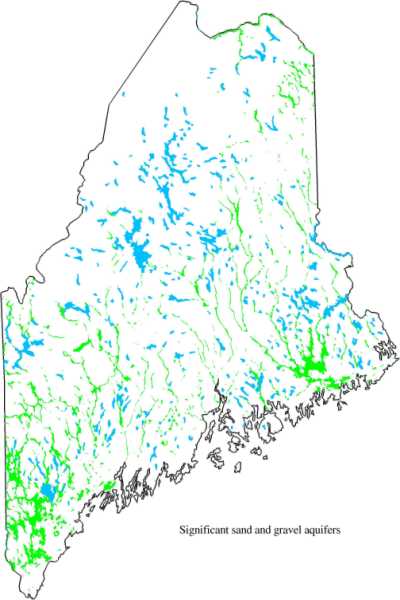
Figure 2. Distribution of mapped sand and gravel aquifers in Maine, shown in green. Northwestern Maine is currently unmapped for sand and gravel aquifers but undoubtedly has some.
Bedrock aquifer
The entire state of Maine is underlain with hard ledge (bedrock) composed of igneous (granite, etc.) and metamorphic (gneiss, etc.) rock. Almost everywhere, this bedrock is fractured due to the many geological processes the rocks have endured since they formed between 360 and 650 million years ago. The fractures in the rock provide the open space (porosity) through which groundwater flows. Fractured bedrock in Maine is recharged locally. The usage of groundwater from drilled wells affects the water table only locally.
Figure 1 shows a well drilled into the bedrock where it intersects several fractures that provide water to the well. The water level in the well will rise to close to the local water table level due to hydrostatic pressure even if the fracture is deep. The average depth for a drilled well in Maine is about 250 feet. Figure 3 shows an example of groundwater flow in a fracture.
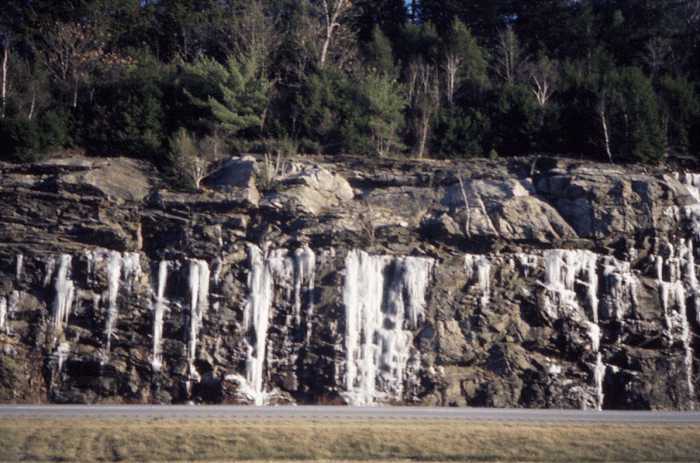
Figure 3. Example of ground-water flow along a fracture. Most of the ground water in the area of this photograph is flowing along a single, near-horizontal fracture. I-95 near Falmouth. Fractured bedrock aquifers are recharged locally and effects of their use are local.
A common perception of an aquifer is a single, confined geological unit that underlies a vast area but has a limited recharge area (Figure 4). This type of aquifer is typical in the western United States but is not representative of Maine aquifers.
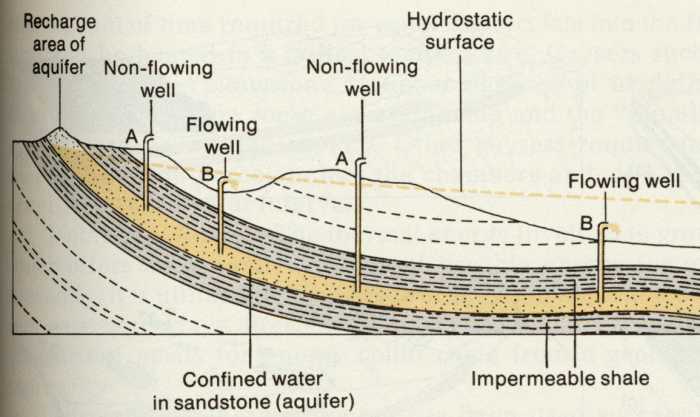
Figure 4. Example of a confined aquifer typical of the western U.S. The aquifer unit is broadly distributed over thousands of square miles but has a very limited recharge area. Usage impacts can be severe.
Groundwater recharge
In Maine groundwater levels fluctuate systematically throughout the year as the resource is recharged in the spring from runoff and rain. Groundwater levels decline during the summer and fall as available precipitation is consumed by evapotranspiration processes, and groundwater in storage flows into surface water. Figure 5 shows a multiyear cycle of recharge and decline for a well in southern Maine. For the period of record, annual fluctuations are on the order of 3-4 feet but the average groundwater level has not declined or increased significantly.
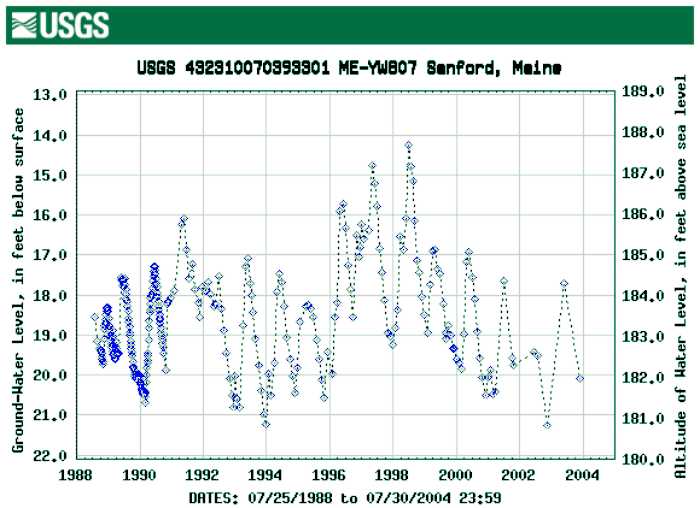
Figure 5. Water levels in Sanford well. From U.S. Geological Survey.
This is in sharp contrast to aquifers in the western United States. Figure 6 shows a multiyear record for a well in the Texas panhandle in the Ogallala aquifer. About 30 percent of the ground water used for irrigation in the U.S. is pumped from this aquifer, about 14 billion gallons per day in 19907. It is also an important public water supply, serving 2.2 million people with 332 million gallons per day in 19907. In an area that receives only 19 inches of rain annually, this rate of use greatly exceeds recharge, resulting in groundwater mining, clearly reflected in the decline of water levels shown in Figure 6.
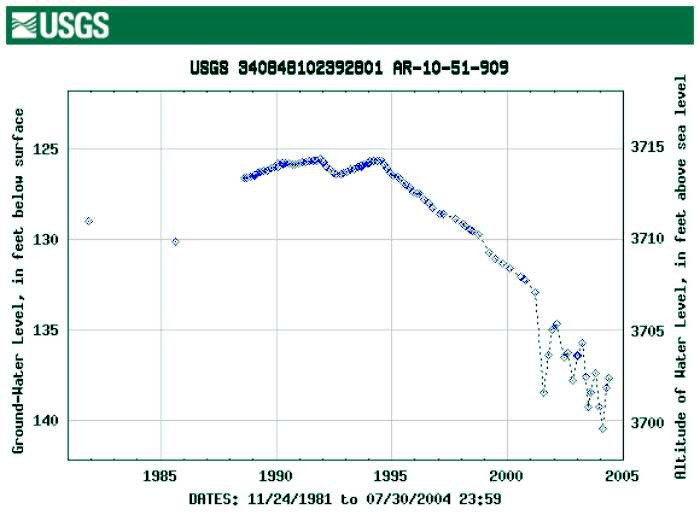
Figure 6. Water level in Ogallala aquifer, Texas.
Groundwater issues
- Low yield bedrock wells
- This is a problem in areas where the bedrock is sparsely fractured and can have significant impact on homeowners and communities.
- Saltwater intrusion
- This is an issue in many coastal communities where development (and private wells) is clustered along the shoreline.
- Withdrawal effects on surface water
- Groundwater and surface water are linked. Extraction/use must always be discussed in the context of impact on surface waters.
- Quality
- Natural quality issues - metals (As, Cd, others). Man-made quality issues - hydrocarbons, pesticides. Regardless of the source, it is much more difficult and expensive to remediate problems than to prevent them.
Notes
- National Weather Service, National Climate Data Center, Historic Climatography Series No. 4-2.
- Calculated from Nichols, W.J., Jr. and Cowing, D.J., 1990, Maine water supply and use: U.S. Geological Survey, Water Supply Paper 2350, p. 283-290
- Caswell, B.H., 1987, Groundwater handbook for the State of Maine: Maine Geological Survey Bulletin 39.
- Summarized from digital maps of aquifers, as mapped by the Maine Geological Survey.
- Calculated from Stewart, G.J., Caldwell, J.M., and Cloutier, J.R., 2003, Water resources data, Maine, Water Year 2003: U.S. Geological Survey, Water-Data Report ME-03-1.
- Portland Water District.
- USGS National Water-Quality Assessment (NAWQA) Program, High Plains Regional Ground Water (HPGW) Study.
Last updated on March 12, 2025