|
|
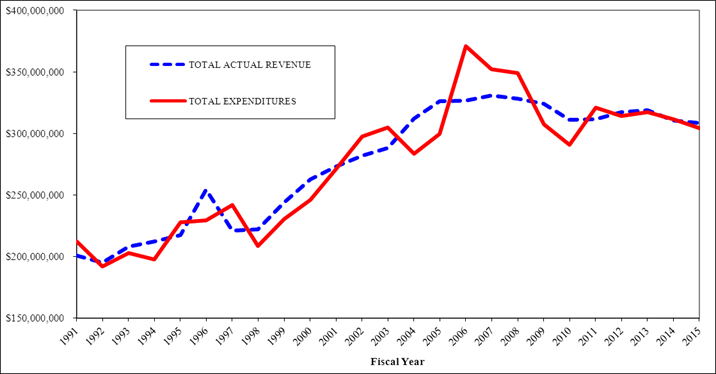
Highway Fund - Revenue and Expenditure History (PDF Version)
| HIGHWAY FUND REVENUE AND EXPENDITURE
HISTORY |
| BUDGETS
VS. ACTUALS: FY 1991 - FY 2015 |
|
|
|
|
|
|
|
|
|
|
|
|
H I G H W
A Y F U N D R E V E N U E |
H I G H W A Y F U
N D S P E N D I N G |
|
|
|
|
|
|
|
|
|
|
| |
|
TOTAL |
|
TOTAL |
|
|
|
|
|
| FISCAL |
|
BUDGETED |
% |
ACTUAL |
% |
TOTAL |
% |
TOTAL |
% |
| YEAR |
|
REVENUE |
CHG. |
REVENUE |
CHG. |
ALLOCATIONS |
CHG. |
EXPENDITURES |
CHG. |
| 1991 |
|
197,198,492 |
-0.2% |
200,856,496 |
3.1% |
192,750,919 |
-8.5% |
212,200,391 |
2.5% |
| 1992 |
|
200,402,553 |
1.6% |
195,039,136 |
-2.9% |
200,302,871 |
3.9% |
191,892,858 |
-9.6% |
| 1993 |
|
202,246,010 |
0.9% |
208,240,701 |
6.8% |
202,236,547 |
1.0% |
202,866,404 |
5.7% |
| 1994 |
|
206,183,051 |
1.9% |
212,105,290 |
1.9% |
203,274,764 |
0.5% |
197,760,854 |
-2.5% |
| 1995 |
|
215,180,481 |
4.4% |
217,412,730 |
2.5% |
222,440,097 |
9.4% |
227,800,908 |
15.2% |
| 1996 |
|
252,320,460 |
17.3% |
254,214,918 |
16.9% |
260,799,573 |
17.2% |
229,417,541 |
0.7% |
| 1997 |
|
222,297,932 |
-11.9% |
220,942,617 |
-13.1% |
229,405,395 |
-12.0% |
242,135,329 |
5.5% |
| 1998 |
|
215,932,305 |
-2.9% |
221,876,271 |
0.4% |
215,984,090 |
-5.9% |
208,817,043 |
-13.8% |
| 1999 |
|
237,482,127 |
10.0% |
244,163,962 |
10.0% |
215,167,045 |
-0.4% |
230,675,828 |
10.5% |
| 2000 |
|
249,063,515 |
4.9% |
262,918,938 |
7.7% |
268,704,902 |
24.9% |
245,942,060 |
6.6% |
| 2001 |
|
263,855,967 |
5.9% |
273,117,902 |
3.9% |
293,315,365 |
9.2% |
270,749,229 |
10.1% |
| 2002 |
|
272,347,857 |
3.2% |
281,984,017 |
3.2% |
290,385,517 |
-1.0% |
297,650,294 |
9.9% |
| 2003 |
|
284,246,567 |
4.4% |
288,246,084 |
2.2% |
288,309,449 |
-0.7% |
304,987,282 |
2.5% |
| 2004 |
|
304,744,317 |
7.2% |
312,027,986 |
8.3% |
293,574,323 |
1.8% |
283,343,403 |
-7.1% |
| 2005 |
|
323,266,157 |
6.1% |
326,078,155 |
4.5% |
310,931,897 |
5.9% |
299,596,972 |
5.7% |
| 2006 |
|
330,907,159 |
2.4% |
326,546,157 |
0.1% |
349,584,284 |
12.4% |
370,948,351 |
23.8% |
| 2007 |
|
330,757,329 |
0.0% |
330,821,083 |
1.3% |
346,221,340 |
-1.0% |
352,202,706 |
-5.1% |
| 2008 |
|
326,356,039 |
-1.3% |
328,136,579 |
-0.8% |
336,160,213 |
-2.9% |
349,155,025 |
-0.9% |
| 2009 |
|
325,149,640 |
-0.4% |
324,242,149 |
-1.2% |
347,664,574 |
3.4% |
307,608,312 |
-11.9% |
| 2010 |
|
309,491,766 |
-4.8% |
311,190,374 |
-4.0% |
316,706,397 |
-8.9% |
290,599,761 |
-5.5% |
| 2011 |
|
308,289,133 |
-0.4% |
311,351,155 |
0.1% |
304,310,083 |
-3.9% |
321,015,262 |
10.5% |
| 2012 |
|
314,971,527 |
2.2% |
317,202,409 |
1.9% |
318,920,211 |
4.8% |
314,187,693 |
-2.1% |
| 2013 |
|
316,679,543 |
0.5% |
316,679,543 |
-0.2% |
311,228,391 |
-2.4% |
318,651,175 |
1.4% |
2014 |
1 |
310,267,211 |
-1.6% |
310,267,211 |
-2.7% |
311,621,111 |
-1.8% |
311,621,111 |
-1.8% |
2015 |
1 |
308,576,740 |
-0.5% |
308,576,740 |
-0.5% |
304,097,673 |
-2.4% |
304,097,673 |
-2.4% |
|
|
|
|
|
|
|
|
|
|
| SOURCES: |
State of Maine Annual Financial Reports/OFPR
Compendia of Fiscal Information & Allocation Summaries |
|
| NOTES: |
1 |
Reflects budgeted
amounts through the 126th Legislature, 2nd Regular Session
|
|
|
|
|
|
|
|
|
|
|
|
|
|
|
|
|
|
|
|
|
|
|
|
|
|
|
|
|
|
|
|
|
|
|
|
|
|
|
|
|
|
|
|
|
|
|
|
|
|
|
|
|
|
|
|
|
|
|
|
|
|
|
|
|
|
|
|
|
|
|
|
|
|
|
|
|
|
|
|
|
|
|
|
|
|
|
|
|
|
|
|
|
|
|
|
|
|
|
|
|
|
|
|
|
|
|
|
|
|
|
|
|
|
|
|
|
|
|
|
|
|
|
|
|
|
|
|
|
|
|
|
|
|
|
|
|
|
|
|
|
|
|
|
|
|
|
|
|
|
|
|
|
|
|
|
|
|
|
|
|
|
|
|
|
|
|
|
|
|
|
|
|
|
|
|
|
|
|
|
|
|
|
|
|
|
|
|
|
|
|
|
|
|
|
|
|
|
|
|
|
|
|
.png)