|
|
| TOTAL STATE EXPENDITURES - ALL FUNDING
SOURCES |
|
|
|
|
|
|
|
|
|
|
|
|
|
|
|
|
|
|
|
|
|
| FISCAL YEAR |
GENERAL FUND |
HIGHWAY FUND |
FEDERAL FUNDS * |
OTHER STATE FUNDS |
TOTAL EXPENDITURES |
|
|
|
|
|
| $ |
% Chg. |
$ |
% Chg. |
$ |
% Chg. |
$ |
% Chg. |
$ |
% Chg. |
|
|
|
|
|
| 1994 |
1,592,804,296 |
|
197,760,855 |
|
1,046,602,192 |
|
605,533,132 |
|
3,442,700,476 |
|
|
|
|
|
|
| 1995 |
1,686,997,648 |
5.9% |
227,800,909 |
15.2% |
1,119,033,246 |
6.9% |
636,648,117 |
5.1% |
3,670,479,920 |
6.6% |
|
|
|
|
|
| 1996 |
1,682,207,127 |
-0.3% |
229,417,541 |
0.7% |
1,162,072,173 |
3.8% |
685,856,700 |
7.7% |
3,759,553,542 |
2.4% |
|
|
|
|
|
| 1997 |
1,768,652,528 |
5.1% |
242,135,329 |
5.5% |
1,215,420,364 |
4.6% |
712,505,078 |
3.9% |
3,938,713,298 |
4.8% |
|
|
|
|
|
| 1998 |
1,898,373,018 |
7.3% |
208,817,043 |
-13.8% |
1,324,495,695 |
9.0% |
713,553,306 |
0.1% |
4,145,239,062 |
5.2% |
|
|
|
|
|
| 1999 |
2,153,508,109 |
13.4% |
230,675,828 |
10.5% |
1,356,063,995 |
2.4% |
606,811,213 |
-15.0% |
4,347,059,145 |
4.9% |
|
|
|
|
|
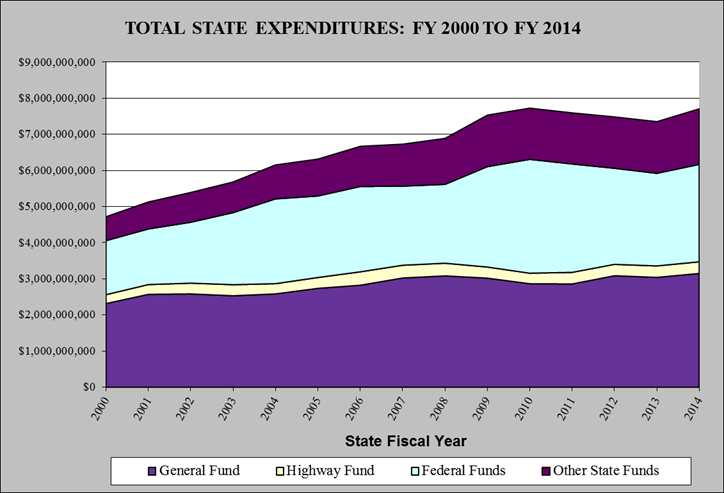
| 2000 |
2,317,138,580 |
7.6% |
245,942,060 |
6.6% |
1,494,733,492 |
10.2% |
662,731,590 |
9.2% |
4,720,545,722 |
8.6% |
|
|
|
|
|
| 2001 |
2,571,368,893 |
11.0% |
270,749,229 |
10.1% |
1,539,761,065 |
3.0% |
747,403,048 |
12.8% |
5,129,282,235 |
8.7% |
|
|
|
|
|
| 2002 |
2,583,684,236 |
0.5% |
297,650,294 |
9.9% |
1,685,480,263 |
9.5% |
825,768,835 |
10.5% |
5,392,583,628 |
5.1% |
|
|
|
|
|
| 2003 |
2,533,197,609 |
-2.0% |
304,987,282 |
2.5% |
1,995,895,366 |
18.4% |
847,781,450 |
2.7% |
5,681,861,707 |
5.4% |
|
|
|
|
|
| 2004 |
2,584,232,096 |
2.0% |
283,343,403 |
-7.1% |
2,346,157,073 |
17.5% |
940,739,873 |
11.0% |
6,154,472,445 |
8.3% |
|
|
|
|
|
| 2005 |
2,738,123,135 |
6.0% |
299,596,972 |
5.7% |
2,256,197,990 |
-3.8% |
1,021,235,651 |
8.6% |
6,315,153,748 |
2.6% |
|
|
|
|
|
| 2006 |
2,824,410,407 |
3.2% |
370,948,351 |
23.8% |
2,360,956,923 |
4.6% |
1,112,524,920 |
8.9% |
6,668,840,602 |
5.6% |
|
|
|
|
|
| 2007 |
3,024,363,451 |
7.1% |
352,202,706 |
-5.1% |
2,189,941,949 |
-7.2% |
1,162,715,301 |
4.5% |
6,729,223,407 |
0.9% |
|
|
|
|
|
| 2008 |
3,083,641,475 |
2.0% |
349,155,025 |
-0.9% |
2,182,289,850 |
-0.3% |
1,272,920,938 |
9.5% |
6,888,007,288 |
2.4% |
|
|
|
|
|
| 2009 |
3,019,800,023 |
-2.1% |
307,608,312 |
-11.9% |
2,778,286,835 |
27.3% |
1,427,625,058 |
12.2% |
7,533,320,229 |
9.4% |
|
|
|
|
|
| 2010 |
2,866,433,517 |
-5.1% |
290,599,761 |
-5.5% |
3,150,727,852 |
13.4% |
1,417,786,734 |
-0.7% |
7,725,547,863 |
2.6% |
|
|
|
|
|
| 2011 |
2,859,043,111 |
-0.3% |
321,015,262 |
10.5% |
3,000,286,460 |
-4.8% |
1,414,806,375 |
-0.2% |
7,595,151,209 |
-1.7% |
|
|
|
|
|
| 2012 |
3,087,289,656 |
8.0% |
314,187,693 |
-2.1% |
2,659,318,998 |
-11.4% |
1,422,158,815 |
0.3% |
7,482,955,162 |
-1.5% |
|
|
|
|
|
| 2013 |
3,040,965,276 |
-1.5% |
317,286,359 |
1.0% |
2,562,739,045 |
-3.6% |
1,430,865,280 |
1.1% |
7,351,855,960 |
-1.8% |
|
|
|
|
|
| 2014 |
3,149,348,298 |
3.6% |
323,035,476 |
2.8% |
2,695,758,316 |
1.4% |
1,537,896,443 |
8.7% |
7,706,038,533 |
3.0% |
|
|
|
|
|
|
|
|
|
|
|
|
|
|
|
|
|
|
|
|
|
| Ave. Growth - 2000 to 2014: |
2.2% |
|
2.0% |
|
4.3% |
|
6.2% |
|
3.6% |
|
|
|
|
|
| Ave. Growth - 2005 to 2014: |
1.6% |
|
0.8% |
|
2.0% |
|
4.7% |
|
2.2% |
|
|
|
|
|
| Ave. Growth - 2010 to 2014: |
2.4% |
|
2.7% |
|
-3.8% |
|
2.1% |
|
-0.1% |
|
|
|
|
|
|
|
|
|
|
|
|
|
|
|
|
|
|
|
|
|
|
|
|
|
|
|
|
|
|
|
|
|
|
|
|
|
|
|
|
|
|
|
|
|
|
|
|
|
|
|
|
|
|
|
|
|
|
|
|
|
|
|
|
|
|
|
|
|
|
|
|
|
|
|
|
|
|
|
|
|
|
|
|
|
|
|
|
|
|
|
|
|
|
|
|
|
|
|
|
|
|
|
|
|
|
|
|
|
|
|
|
|
|
|
|
|
|
|
|
|
|
|
|
|
|
|
|
|
|
|
|
|
|
|
|
|
|
|
|
|
|
|
|
|
|
|
|
|
|
|
|
|
|
|
|
|
|
|
|
|
|
|
|
|
|
|
|
|
|
|
|
|
|
|
|
|
|
|
|
|
|
|
|
|
|
|
|
|
|
|
|
|
|
|
|
|
|
|
|
|
|
|
|
|
|
|
|
|
|
|
|
|
|
|
|
|
|
|
|
|
|
|
|
|
|
|
|
|
|
|
|
|
|
|
|
|
|
|
|
|
|
|
|
|
|
|
|
|
|
|
|
|
|
|
|
|
|
|
|
|
|
|
|
|
|
|
|
|
|
|
|
|
|
|
|
|
|
|
|
|
|
|
|
|
|
|
|
|
|
|
|
|
|
|
|
|
|
|
|
|
|
|
|
|
|
|
|
|
|
|
|
|
|
|
|
|
|
|
|
|
|
|
|
|
|
|
|
|
|
|
|
|
|
|
|
|
|
|
|
|
|
|
|
|
|
|
|
|
|
|
|
|
|
|
|
|
|
|
|
|
|
|
|
|
|
|
|
|
|
|
|
|
|
|
|
|
|
|
|
|
|
|
|
|
|
|
|
|
|
|
|
|
|
|
|
|
|
|
|
|
|
|
|
|
|
|
|
|
|
|
|
|
|
|
|
|
|
|
|
|
|
|
|
|
|
|
|
|
|
|
|
|
|
|
|
|
|
|
|
|
|
|
|
|
|
|
|
|
|
|
|
|
|
|
|
|
|
|
|
|
|
|
|
|
|
|
|
|
|
|
|
|
|
|
|
|
|
|
|
|
|
|
|
|
|
|
|
|
|
|
|
|
|
|
|
|
|
|
|
|
| SOURCES: State
of Maine Annual Budgetary Financial Reports and Accounting Records |
|
|
|
|
|
|
|
|
|
|
|
|
|
|
|
|
|
|
|
|
|
|
|
|
|
|
| * Federal Funds includes Federal Expenditures Fund, Federal
Block Grant Fund and Federal Stimulus or American Recovery and Reinvestment
Act (ARRA) Funds. ARRA actual
expenditures were $240,544,841 in FY
2009, $690,285,452 in FY 2010, $561,253,766 in FY 2011, $216,513,229 in FY
2012 and $119,214,716 in FY 2013. |
|
|
|
|
|
|
|
|
|
|
|
|
|
|
|
|
|
|
|
|
|
|
|
|
|
|
|
|
|
|
|
|
|
|
|
|
|
|
.png)