MaineDOT - Map Viewer Tutorial
Welcome the new and improved Map Viewer! (v2.2)

Use the following links to explore the Map Viewer menus in detail:
Layers Menu
Back to top*** New to version 2.2 - Enhanced layer functionality! ***
The internal Map Viewer now allows you to add filters and view tables associated with User Layers. To access these enhancements, click on the Layers drop-down menu > Map Layer tab.
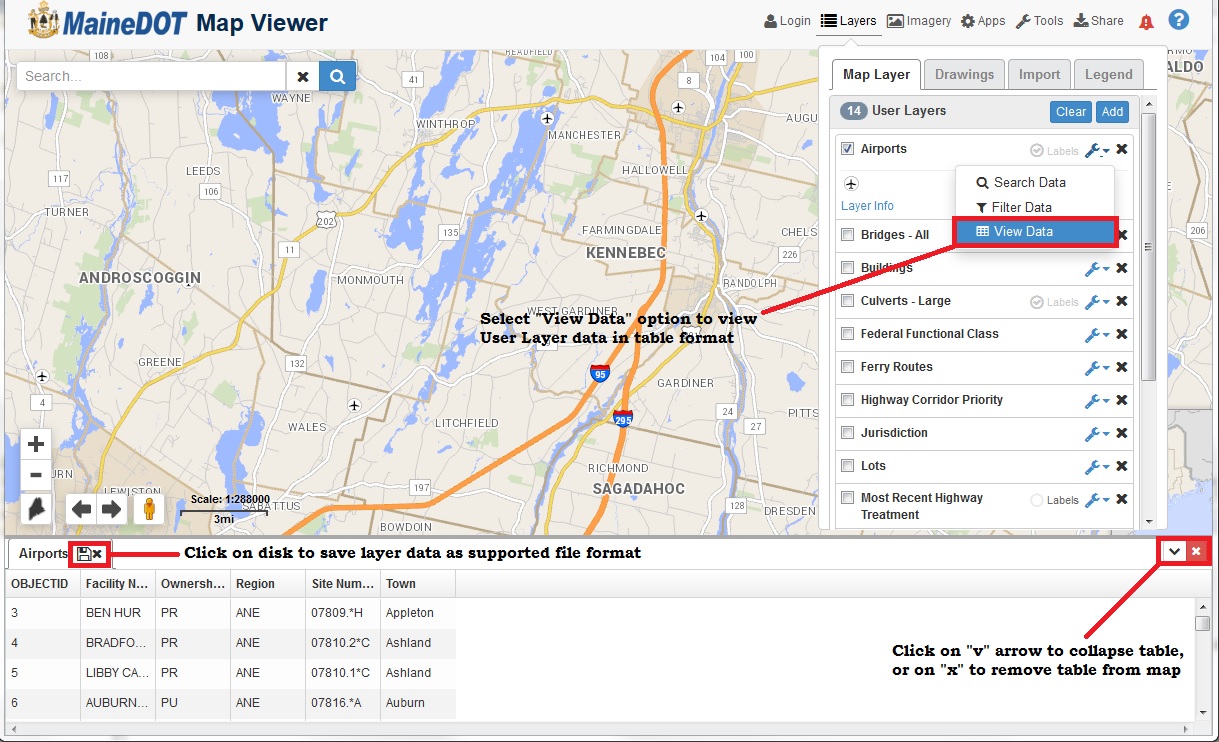
 Clicking on the wrench icon will reveal three options for visualizing the User Layer data: Search, Filter and View data.
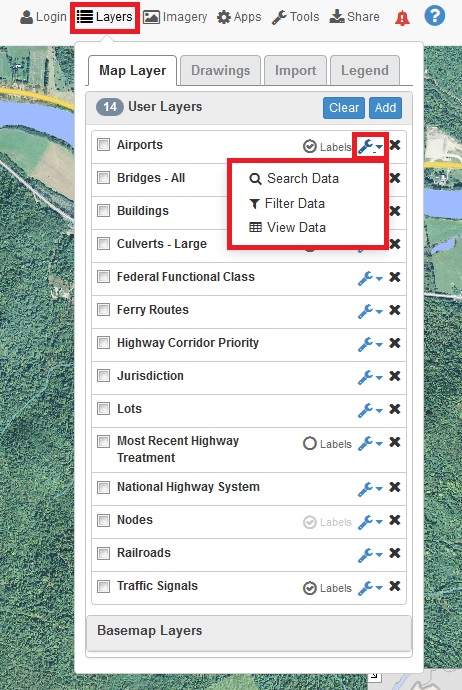
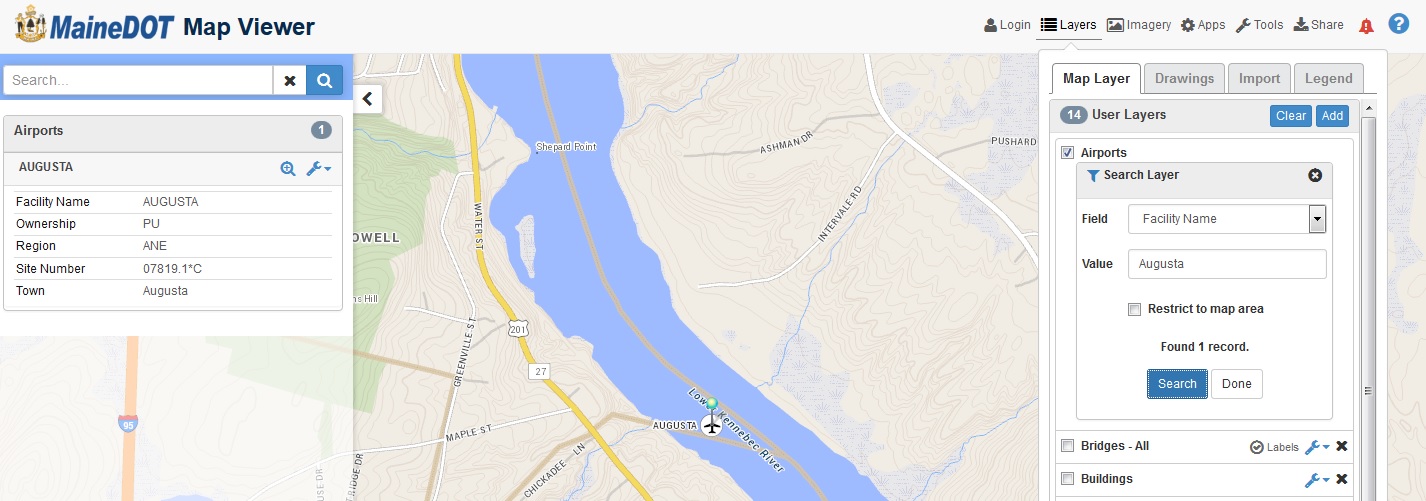
Search Data: Search individual layers based on a value that exists in the selected field.
For example, when viewing the Airports User Layer, you can search the "Facility Name" field for a value of "Augusta". Clicking the "Search" button returns 1 record. The record information will be displayed to the left of the screen (collapsed if more than one record is found), and the map will automatically zoom to the extent of the returned records:
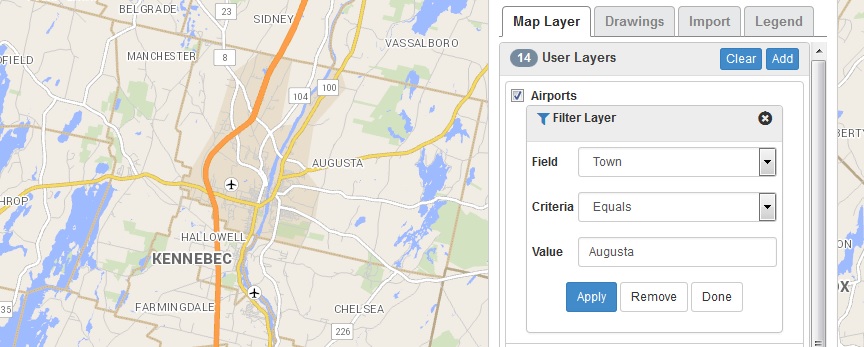
Filter Data: Filter / Display data based on specific field criteria.
Example - Filter the Airports User Layer so that "Town" + "Equals" + "Augusta". Only the records in the Airports User Layer meeting that criteria will be displayed on the map.
When this filter is applied, two records are returned and displayed on the map:
View and Export Data: View selected User Layer records in a table and export to supported file formats (Excel Spreadsheet, ESRI Shapefile, or Google KML).
**Note** If a filter has been applied to the layer, only the data meeting the criteria of the filter will be displayed in the table. To display all data for the User Layer, the filter must be removed (User Layer > Filter Layer > "Remove"). Similarly, if a filter has been applied, only the data that meets the filter criteria will be available to export to supported file formats.
Add Layers
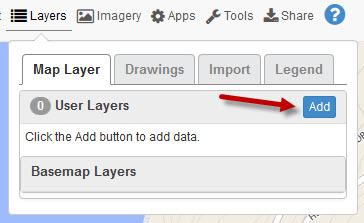
To access and add Map Layers to your map, click on the “Layers” option on the menu bar.
With the Map Layer tab open, click the Add button.
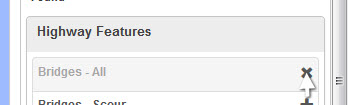
A list of “Common” layers will open up for you to choose from. Place your cursor on the plus sign. That will high light the layer. Click it. The layer will draw on the map. The draw time will vary depending on how big the layer is. The + will turn to a ×.
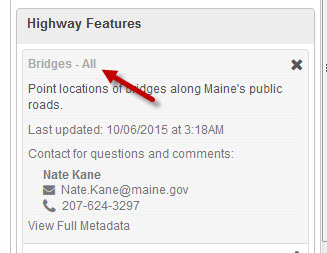
You can get layer data before or after you turn it on, by clicking on the layer title.
Search for Layers
You can also search for layers that are not in the list of common layers. Start typing in the data layer search window. If there are related layers (by spelling, or with typed words in metadata) they will be listed in the window.
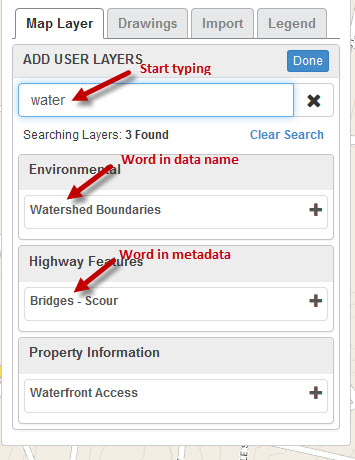
Click on the + and the layer will be added.
Click the “Done” button when you are done adding layers
Drawings
The "Drawings" tab allows you to add points, lines, polygons, shapes, and labels to your map. Choose the tool you want and click it.
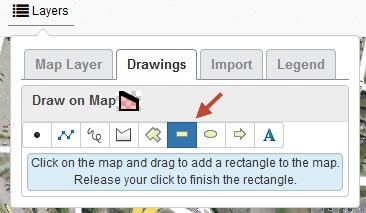
A description of how the tool works opens under the tool.
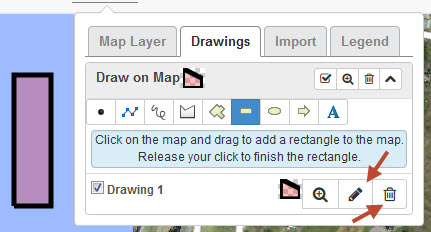
After drawing on your map, you can name the drawing. Click the pencil icon to open an "edit drawing" window. There you can change the name, determine symbology, and give a brief description of the drawing.
The trashcan icon lets you delete the drawing if it is not what you wanted.
The Zoom icon will pan your map to the extents of the drawing.
The check box turns on and off the individual drawing.
When you create a drawing, you will notice another set of icons appear on the title bar.
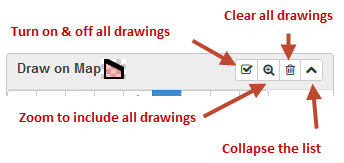
These icons function the same as the individual drawing tools, except they work on all the drawings in the map.
NOTE: There is no undo!!! Be sure you want to clear all drawings.
Import
You can Add your own data to the map viewer. Supported formats are KML/KMZ files, GPX files, and CSV data.
Legend
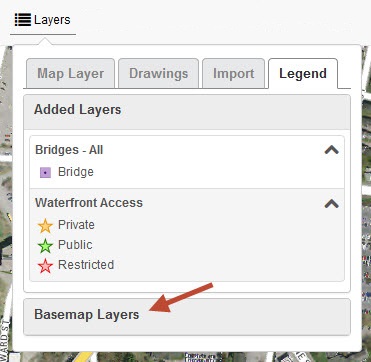
The Legend tab shows the added layers that are active in the current map. (Does not include Basemap Layers) You can click on the "Basemap Layers" in the legend tab, and it will expand to show what is in the Basemap.
41 Common V. All 124 Layers
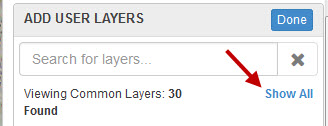
When adding layers, if you don't see the layer you are looking for, you can open all 104 layers. The "Common Layers" option is default so you don't have a layers list that is unmanageable.
Click the "Show All" option in the window, and all the layers available without importing will be listed in the "Layers" list.
Imagery Menu
Back to topAdd Imagery
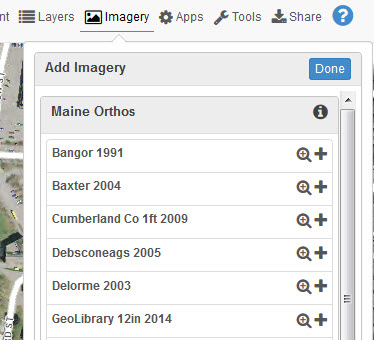
Click the "Imagery" option on the menu bar, and the "Add" button in the window.
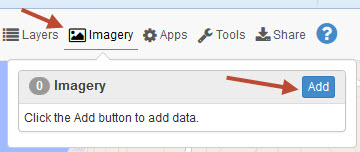
The “Add” button will access all the available imagery as a list.(shown below) Click on the + sign and the image will be added. Click the “Done” button to close the window.
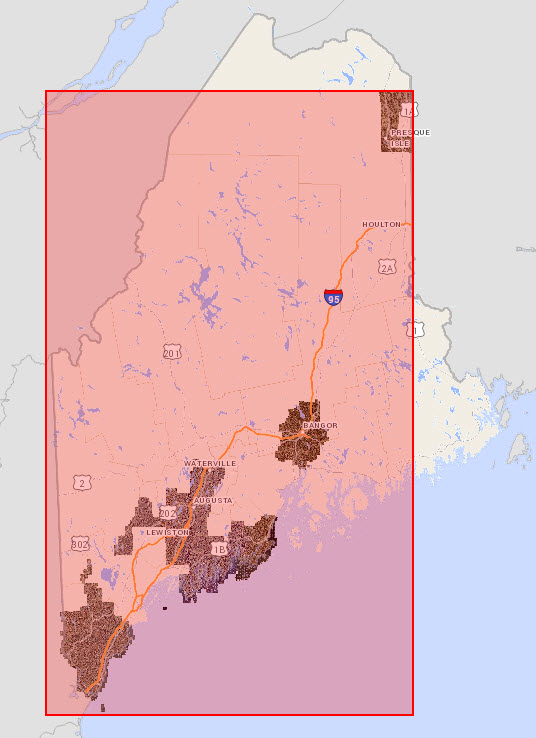
When scrolling through the list of imagery, you may notice that your map highlights (red) when you roll over some of the imagery layers. The illustration to the left shows the full extent of a particular imagery layer in red, although the actual imagery is NOT available for the entire highlighted area. This hover/highlight functionality is designed to help you quickly find the imagery layers that potentially contain imagery in your focus area and eliminate the imagery layers that definitely do not. (No highlight = no imagery available)
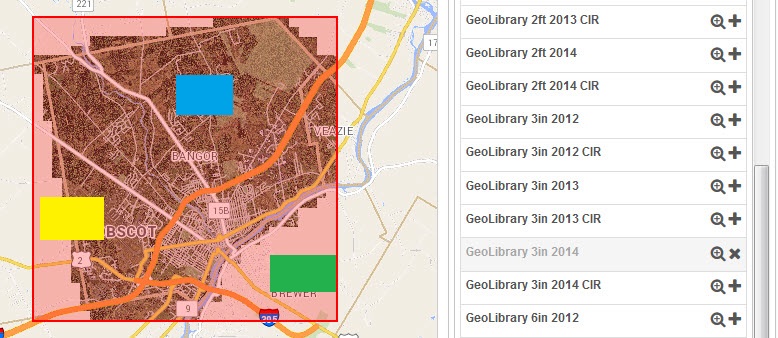
In the illustration above, if your map extents were the green rectangle and you scrolled over the highlighted image, you would not see an image unless you panned north or west. If you were in the blue, you would see imagery upon activation. If your extents were the yellow rectangle, you would see imagery when you turn it on.
Hide Imagery/Data/Change Opacity
The imagery is added under some of the basemap layers and the layers you have added.
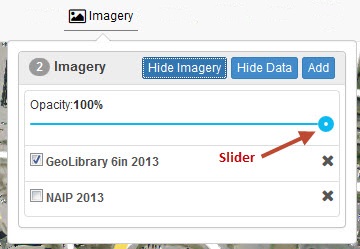
You can hide those layers by clicking the “Hide Data” button.
You can turn the imagery off temporarily using the “Hide Imagery” button. Click it again to turn it back on.
You can use the slider to determine transparency of the imagery. The higher the “Opacity” percentage, the less you see through the image.
Remove Imagery
Click the × next to the image you want to remove, and it will be deleted from the list and map.
Apps Menu
Back to top
Applications: An important aspect of the Map Viewer is the ability to be extended with additional functionality and interfaces. There are currently three new "Apps":
- 511 Traffic Camera Viewer - View live images captured every few minutes from traffic cameras. Just click the icon to launch this app and click one of the cameras that appear on the map.
- Internet Maps – Launch other web-mapping applications (Bing, Google, MapQuest etc.), which will automatically zoom to your current Map Viewer location.
- Maine Waze Viewer – View real-time traffic events reported by travelers through Waze (Google’s traffic data gathering and reporting system).
Tools Menu
Back to top
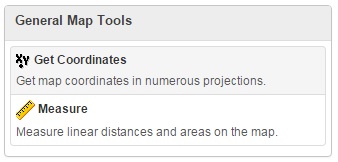
Map Viewer Tools are divided into two groups, the General Map Tools (Get Coordinates, Measure) and Road Network Tools (Route Mile Point, Route Segment, Get Address).
The Get Coordinates tool allows the user to get coordinates in numerous projections. Click anywhere on the map to see the geographic location at that point. (Click on Image to Enlarge)
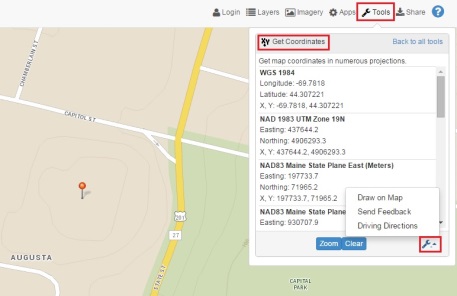
After acquiring a location, by clicking on the symbol, you have the option to Draw on Map, get Driving Directions, or Send Feedback about the location.
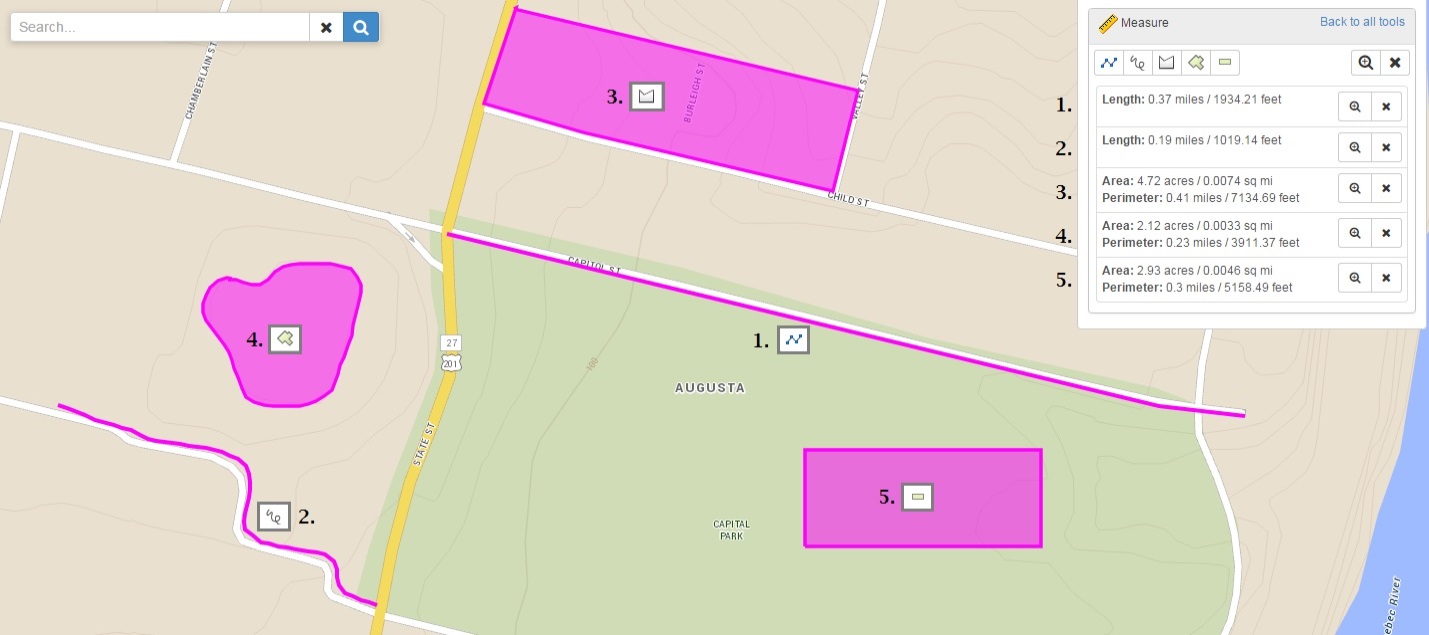
The Measure tools measure linear distances and areas on the map. Five measure tools are available to assist you with your measurements:
- The
 tool allows you to measure linear distances. To use this tool, click on the map to begin drawing a line. Click again to add points to the line. Double-click to end the line. The length in miles and feet will be displayed to the right.
 - The
 tool is a freeform linear measurement tool. To use this tool, click on the map and continue to hold mouse button down. Drag the mouse along a line you wish to measure. When you get to the end of the line, release the mouse. The length will be displayed.
 - The
 tool measures area. To use this tool, click on the map to begin drawing a polygon. Click again to add points around the perimeter of a location. Double-click near the first point to complete the polygon. An area measurement, as well as a perimeter measurement will be displayed.
 - The
 tool is a freeform version of the area measurement tool. To use this tool, click on the map and continue to hold the mouse button down. Drag the mouse around the area you wish to measure. When you've surrounded the area, release the mouse. Area measurements will be displayed.
 - The
 tool is a rectangular area measurement tool. Click on the map and continue to hold the mouse button down. Drag the mouse away from the initial point and over the area to be measured. A rectangular area will be formed. Release the mouse when the desired area has been covered. Area measurements will be displayed.
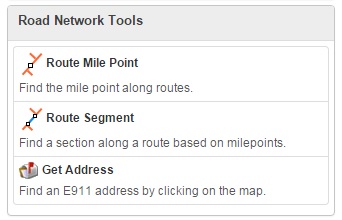
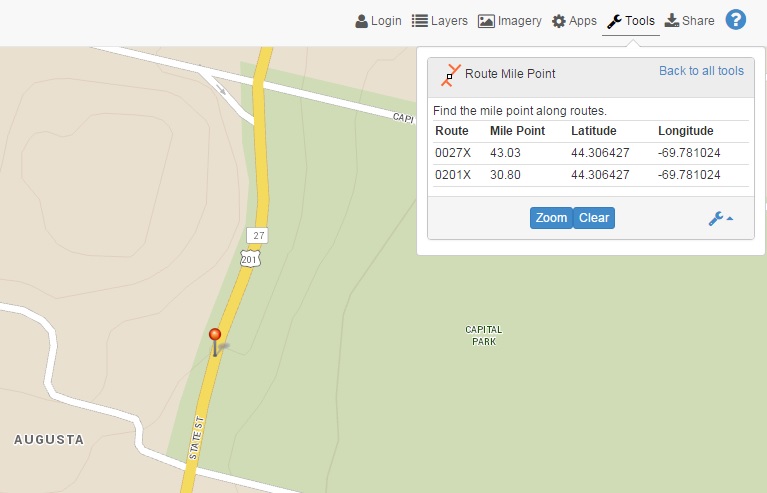
The Route Mile Point tool allows the user to find a mile point along routes.
Click on a road to see the route mile point at that location.

The Route Segment tool finds a section along a route based on mile points.
Click on a road to get the route log mile - you may have to choose between multiple routes.
Click on the route again to get a second route log mile.
Click the Get Route Segment button to show the segment.
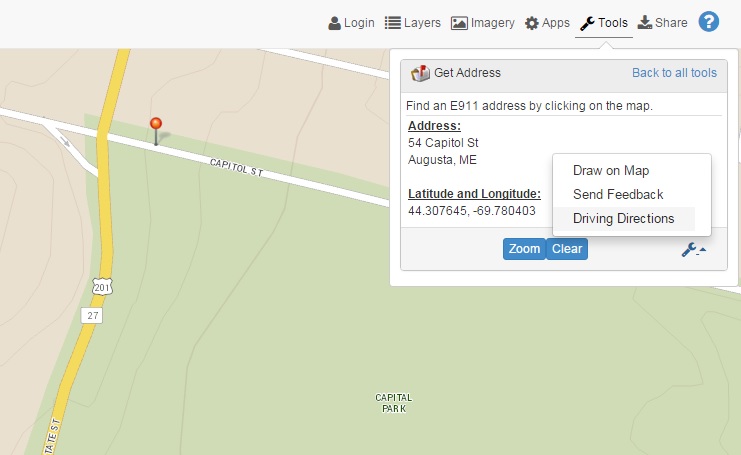
The Get Address tool finds an E911 address by clicking on the map.
Click on a road to get an approximate address at that location.
Share Menu
Back to top
After creating a map display, there are various ways to share or communicate your map to others. You have the option of sending an email, creating a link, or downloading to a supported image format. This can be accomplished through the Share Menu. The different options are explained below.
Sending an Email
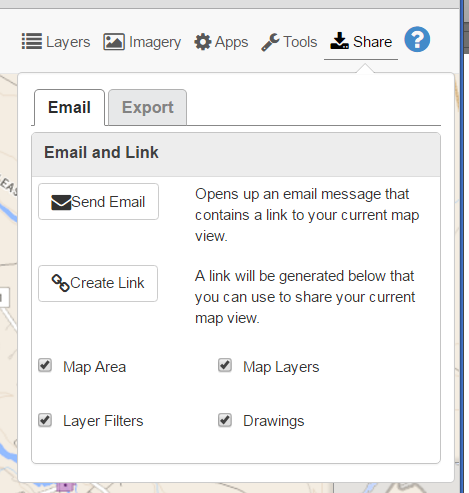
To send an email displaying your map information, click on the Share Menu > Email tab. Depending on the information you desire to share, you have the option to check or uncheck boxes associated with the Map Area, May Layers, and Map Drawings. When you click on the Send Email button, an email will open with a link customized to display the options you have checked. This link will remain available for at least two months.
Creating a Link
Creating a link is similar in process to Sending an Email. When you desire to share your map information (Map Area, Map Layers, Map Drawings), click on the Create Link button. A link will be generated on the Email tab. You can then copy and paste the link as you see fit - such as the body of email, or as part of a web page:
Downloading a Map
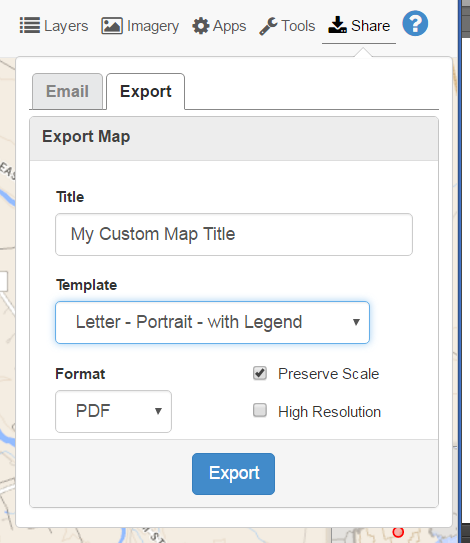
From the Share Menu > Download tab, you can choose the option to export a static version of your map to one of many supported image formats and template types. From the Download tab, enter a Title for your map. Choose an image format to export to and assign a template that best displays your data. If you choose the MAP_ONLY option, a map will be created WITHOUT map elements (title, legend, scale, north arrow,etc).
Help Menu
Back to top
To access the Help Menu, click on the question mark.
The Help menu is divided into three tabs: Help, Feedback and About.
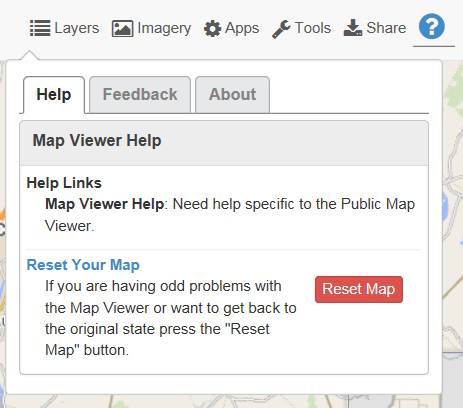
By clicking on the Help tab, you will find links to the following:
- Help Links allow you to access the Map Viewer Help - Map Viewer Tutorial, How-To Documents and Frequently Asked Questions (FAQs).
- If you are encountering any odd behavior while using the Map Viewer, or if you wish to revert back to the original settings (extent, layers, etc.), click on the Reset Map button.
Clicking on the Feedback tab will allow you email questions and comments about the Map Viewer. An Outlook email will be populated with the appropriate contacts by clicking on the Email Feedback button. Samples of potential feedback are shown on the Feedback tab. Other information that will assist us with troubleshooting:
 Web Browser Information - are you using Internet Explorer, Google Chrome, Firefox, Etc.? And what version?
Operating System Information - is your machine running Windows 7 (32 or 64-bit) ? Windows 8 ? Windows 10?
Can you replicate the error - if so, can you provide detail instructions on how to do so?
The About tab provides information about the current version of the Map Viewer, as well as plans for future releases. Clicking on the Current release notes link will also give you information about new functionality, enhancements, data layers and cartography.
Additional GIS Questions? Want to schedule formal or informal training? Please do not hesitate to contact GIS Services:
GIS Services Help Desk
(207) 624-3329
GISservices.MaineDOT@maine.gov