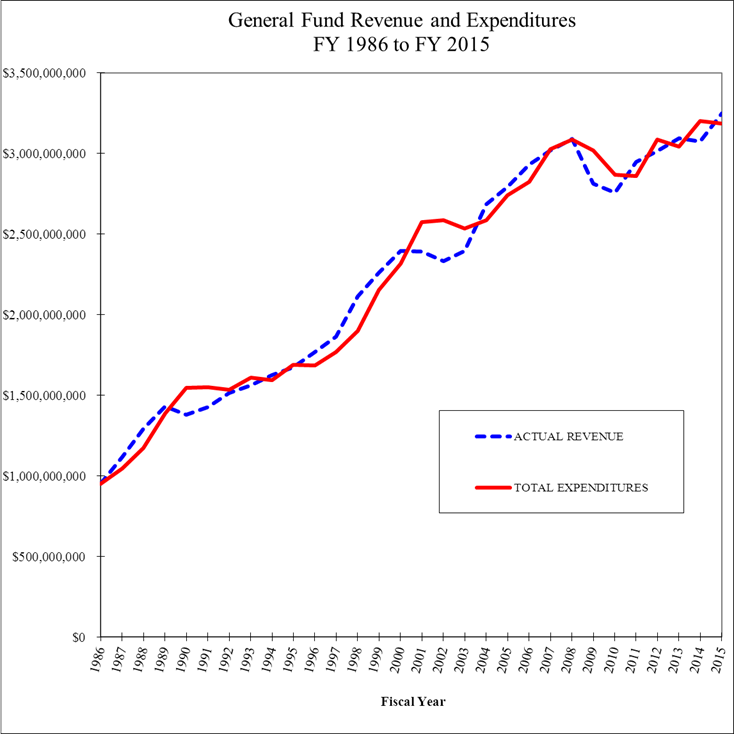
| GENERAL FUND REVENUE AND EXPENDITURE
HISTORY |
|
|
| BUDGETS
VS. ACTUALS: FY 1986- FY 2015 |
|
|
|
|
|
|
|
|
|
|
|
|
|
|
|
|
GENERAL
FUND REVENUE |
GENERAL FUND SPENDING |
|
|
|
|
|
|
|
|
|
|
|
|
|
|
| |
|
TOTAL |
|
|
|
|
|
|
|
|
|
| FISCAL |
|
BUDGETED |
% |
ACTUAL |
% |
TOTAL |
% |
TOTAL |
% |
|
|
| YEAR |
|
REVENUE |
CHG. |
REVENUE |
CHG. |
APPROPRIATIONS |
CHG. |
EXPENDITURES |
CHG. |
|
|
| 1986 |
|
941,553,466 |
|
948,570,405 |
|
961,825,581 |
|
950,501,989 |
|
|
|
| 1987 |
|
1,108,959,076 |
17.8% |
1,117,804,255 |
17.8% |
1,070,583,411 |
11.3% |
1,045,190,655 |
10.0% |
|
|
| 1988 |
|
1,193,950,507 |
7.7% |
1,291,702,852 |
15.6% |
1,184,719,563 |
10.7% |
1,172,430,121 |
12.2% |
|
|
| 1989 |
|
1,381,460,307 |
15.7% |
1,430,615,011 |
10.8% |
1,415,950,225 |
19.5% |
1,384,757,750 |
18.1% |
|
|
| 1990 |
|
1,422,784,668 |
3.0% |
1,379,458,165 |
-3.6% |
1,520,692,150 |
7.4% |
1,546,860,222 |
11.7% |
|
|
| 1991 |
|
1,431,980,631 |
0.6% |
1,424,084,700 |
3.2% |
1,520,285,074 |
0.0% |
1,550,964,764 |
0.3% |
|
|
| 1992 |
|
1,511,121,884 |
5.5% |
1,512,463,098 |
6.2% |
1,516,169,287 |
-0.3% |
1,533,844,301 |
-1.1% |
|
|
| 1993 |
|
1,552,884,155 |
2.8% |
1,561,402,638 |
3.2% |
1,577,593,982 |
4.1% |
1,606,620,231 |
4.7% |
|
|
| 1994 |
|
1,597,301,393 |
2.9% |
1,623,888,486 |
4.0% |
1,599,447,945 |
1.4% |
1,592,804,301 |
-0.9% |
|
|
| 1995 |
|
1,665,254,124 |
4.3% |
1,671,736,430 |
2.9% |
1,673,401,754 |
4.6% |
1,686,997,648 |
5.9% |
|
|
| 1996 |
|
1,735,173,575 |
4.2% |
1,766,400,761 |
5.7% |
1,733,842,806 |
3.6% |
1,685,207,128 |
-0.1% |
|
|
| 1997 |
|
1,803,517,546 |
3.9% |
1,863,086,301 |
5.5% |
1,815,498,708 |
4.7% |
1,768,652,528 |
5.0% |
|
|
| 1998 |
1 |
1,927,664,314 |
6.9% |
2,111,860,005 |
13.4% |
1,888,812,553 |
4.0% |
1,898,373,018 |
7.3% |
|
|
| 1999 |
2 |
2,181,100,948 |
13.1% |
2,259,718,302 |
7.0% |
2,201,734,442 |
16.6% |
2,153,508,109 |
13.4% |
|
|
| 2000 |
|
2,361,714,282 |
8.3% |
2,395,216,806 |
6.0% |
2,316,629,198 |
5.2% |
2,317,138,580 |
7.6% |
|
|
| 2001 |
|
2,358,010,018 |
-0.2% |
2,390,628,351 |
-0.2% |
2,645,121,992 |
14.2% |
2,571,368,893 |
11.0% |
|
|
| 2002 |
|
2,424,196,674 |
2.8% |
2,331,660,562 |
-2.5% |
2,565,345,849 |
-3.0% |
2,583,684,236 |
0.5% |
|
|
| 2003 |
|
2,372,305,554 |
-2.1% |
2,394,690,190 |
2.7% |
2,540,382,576 |
-1.0% |
2,533,197,609 |
-2.0% |
|
|
| 2004 |
|
2,620,476,211 |
10.5% |
2,683,539,557 |
12.1% |
2,642,999,485 |
4.0% |
2,584,232,096 |
2.0% |
|
|
| 2005 |
|
2,760,939,443 |
5.4% |
2,790,845,053 |
4.0% |
2,784,473,472 |
5.4% |
2,738,123,135 |
6.0% |
|
|
| 2006 |
|
2,857,738,104 |
3.5% |
2,931,825,687 |
5.1% |
2,871,878,613 |
3.1% |
2,824,410,407 |
3.2% |
|
|
| 2007 |
|
3,004,907,574 |
5.1% |
3,019,595,389 |
3.0% |
2,978,358,710 |
3.7% |
3,024,363,451 |
7.1% |
|
|
| 2008 |
|
3,040,740,422 |
1.2% |
3,087,818,992 |
2.3% |
3,129,325,355 |
5.1% |
3,083,641,475 |
2.0% |
|
|
| 2009 |
|
2,854,763,148 |
-6.1% |
2,811,368,295 |
-9.0% |
3,017,952,419 |
-3.6% |
3,019,800,023 |
-2.1% |
|
|
| 2010 |
|
2,693,005,389 |
-5.7% |
2,755,682,500 |
-2.0% |
2,849,227,923 |
-5.6% |
2,866,433,517 |
-5.1% |
|
|
| 2011 |
|
2,896,064,524 |
7.5% |
2,944,956,756 |
6.9% |
2,872,754,172 |
0.8% |
2,859,043,111 |
-0.3% |
|
|
| 2012 |
|
2,995,444,736 |
3.4% |
3,015,538,222 |
2.4% |
3,130,209,894 |
9.0% |
3,087,289,656 |
8.0% |
|
|
2013 |
|
3,056,234,628 |
2.0% |
3,056,234,628 |
1.3% |
3,012,524,581 |
-3.8% |
3,012,524,581 |
-2.4% |
|
|
2014 |
3 |
3,074,367,119 |
0.9% |
3,074,367,119 |
-0.6% |
3,199,811,630 |
3.8% |
3,199,811,630 |
5.2% |
|
|
2015 |
3 |
3,247,324,775 |
5.6% |
3,247,324,775 |
5.6% |
3,184,175,891 |
-0.5% |
3,184,175,891 |
-0.5% |
|
|
| |
|
|
|
|
|
|
|
|
|
|
|
|
|
|
|
|
|
|
|
|
|
|
|
| Sources: |
State of Maine Annual Financial Reports/OFPR
Compendia of Fiscal Information & Appropriations Summaries |
|
|
|
| Notes: |
1 |
Actual FY 98 Revenue includes all "Tax
Relief Fund for Maine Residents" and "Tobacco Tax Relief Fund"
revenues |
|
|
|
|
2 |
Budgeted and Actual FY 99 Revenue includes
$22,595,032 transferred pursuant MRSA 36 §1811 |
|
|
|
|
3 |
Budgeted amounts through
the 126th Legislature, 2nd Regular Session |
|
|
|
|
|
|
|
|
|
|
|
|
|
|
|
|
|
|
|
|
|
|
|
|
|
|
|
|
|
|
|
|
|
|
|
|
|
|
|
|
|
|
|
|
|
|
|
|
|
|
|
|
|
|
|
|
|
|
|
|
|
|
|
|
|
|
|
|
|
|
|
|
|
|
|
|
|
|
|
|
|
|
|
|
|
|
|
|
|
|
|
|
|
|
|
|
|
|
|
|
|
|
|
|
|
|
|
|
|
|
|
|
|
|
|
|
|
|
|
|
|
|
|
|
|
|
|
|
|
|
|
|
|
|
|
|
|
|
|
|
|
|
|
|
|
|
|
|
|
|
|
|
|
|
|
|
|
|
|
|
|
|
|
|
|
|
|
|
|
|
|
|
|
|
|
|
|
|
|
|
|
|
|
|
|
|
|
|
|
|
|
|
|
|
|
|
|
|
|
|
|
|
|
|
|
|
|
|
|
|
|
|
|
|
|
|
|
|
|
|
|
|
|
|
|
|
|
|
|
|
|
|
|
|
|
|
|
|
|
|
|
|
|
|
|
|
|
|
|
|
|
|
|
|
|
|
|
|
|
|
|
|
|
|
|
|
|
|
|
|
|
|
|
|
|
|
|
|
|
|
|
|
|
|
|
|
|
|
|
|
|
|
|
|
|
|
|
|
|
|
|
|
|
|
|
|
|
.png)