| General Fund Expenditures - By Major
Categories |
|
|
|
|
|
|
|
|
|
|
|
|
|
| Major Categories |
FY 2004 |
FY 2005 |
FY 2006 |
FY 2007 |
FY 2008 |
FY 2009 |
FY 2010 |
FY 2011 |
FY 2012 |
FY 2013 |
|
| General Purpose Aid for
Local Schools 4 |
$699,041,403 |
$738,355,049 |
$838,193,470 |
$911,011,767 |
$954,353,096 |
$934,433,865 |
$889,714,836 |
$842,642,113 |
$863,076,706 |
$839,878,111 |
|
| Medicaid/MaineCare 4 |
$505,750,219 |
$582,012,779 |
$643,913,358 |
$604,261,444 |
$607,532,807 |
$558,831,894 |
$437,801,757 |
$483,312,486 |
$723,776,072 |
$730,530,179 |
|
| Personal Services 1 |
$362,183,685 |
$387,727,063 |
$398,416,458 |
$413,015,551 |
$425,571,308 |
$434,115,597 |
$431,759,184 |
$407,400,396 |
$386,024,906 |
$371,981,436 |
|
| Higher Education |
$233,405,441 |
$241,187,901 |
$246,831,523 |
$262,043,743 |
$272,942,825 |
$266,014,980 |
$261,774,007 |
$268,331,934 |
$269,802,793 |
$264,404,717 |
|
| Teachers' Retirement 2 |
$170,014,497 |
$181,698,128 |
$148,459,994 |
$205,443,716 |
$196,871,807 |
$203,926,618 |
$208,993,254 |
$219,061,198 |
$172,592,848 |
$174,932,889 |
|
| Debt Service
3 |
$91,157,529 |
$89,206,568 |
$96,042,927 |
$107,057,363 |
$101,848,646 |
$101,732,401 |
$116,474,424 |
$113,144,014 |
$119,004,542 |
$123,625,014 |
|
| Other |
$522,679,322 |
$517,935,648 |
$452,552,677 |
$521,529,869 |
$524,520,986 |
$520,744,668 |
$519,916,055 |
$525,150,971 |
$553,011,788 |
$535,612,930 |
|
| Total General Fund
Expenditures |
$2,584,232,096 |
$2,738,123,135 |
$2,824,410,407 |
$3,024,363,451 |
$3,083,641,475 |
$3,019,800,023 |
$2,866,433,517 |
$2,859,043,111 |
$3,087,289,656 |
$3,040,965,276 |
|
|
|
|
|
|
|
|
|
|
|
|
|
|
|
|
|
|
|
|
|
|
|
|
|
| 1 Detail of Personal Services: |
|
|
|
|
|
|
|
|
|
|
|
| Salaries and Wages |
$252,008,419 |
$253,691,577 |
$255,744,055 |
$267,887,333 |
$272,705,758 |
$277,640,110 |
$276,899,311 |
$266,563,254 |
$258,730,824 |
$249,000,344 |
|
| Retirement |
$59,776,685 |
$68,282,101 |
$75,723,030 |
$78,659,081 |
$83,910,787 |
$87,256,293 |
$85,656,056 |
$71,610,236 |
$60,024,786 |
$57,628,033 |
|
| Health Insurance |
$37,871,359 |
$53,667,368 |
$54,269,370 |
$53,540,872 |
$55,247,755 |
$55,534,957 |
$55,570,524 |
$57,108,240 |
$55,188,011 |
$53,259,761 |
|
| Other Fringe Benefits |
$12,527,222 |
$12,086,018 |
$12,680,004 |
$12,928,264 |
$13,707,009 |
$13,684,236 |
$13,633,293 |
$12,118,665 |
$12,081,286 |
$12,093,298 |
|
| Total |
$362,183,685 |
$387,727,063 |
$398,416,458 |
$413,015,551 |
$425,571,308 |
$434,115,597 |
$431,759,184 |
$407,400,396 |
$386,024,906 |
$371,981,436 |
|
|
|
|
|
|
|
|
|
|
|
|
|
| 2 Teachers'
Retirement includes Retired Teachers' Health Insurance and Retired Teachers'
Group Life Insurance. |
|
|
|
|
|
|
|
| 3 Includes
General Obligation debt service and Maine Governmental Facilities Authority
debt service, but does not include debt service for court facilities until FY
2010, when that debt service was segregated into a separate program. |
|
| 4 Medicaid and General Purpose Aid for Local Schools
exclude some Personal Services expenditures that would normally be included,
but are excluded here to avoid double counting the amounts in Personal
Services. Medicaid administrative costs are
also not included here. |
|
|
|
|
|
|
|
|
|
|
|
|
|
|
|
|
|
|
|
|
|
|
|
|
|
|
|
|
|
|
|
|
|
|
|
|
|
|
|
|
|
|
|
|
|
|
|
|
|
|
|
|
|
|
|
|
|
|
|
|
|
|
|
|
|
|
|
|
|
|
|
|
|
|
|
|
|
|
|
|
|
|
|
|
|
|
|
|
|
|
|
|
|
|
|
|
|
|
|
|
|
|
|
|
|
|
|
|
|
|
|
|
|
|
|
|
|
|
|
|
|
|
|
|
|
|
|
|
|
|
|
|
|
|
|
|
|
|
|
|
|
|
|
|
|
|
|
|
|
|
|
|
|
|
|
|
|
|
|
|
|
|
|
|
|
|
|
|
|
|
|
|
|
|
|
|
|
|
|
|
|
|
|
|
|
|
|
|
|
|
|
|
|
|
|
|
|
|
|
|
|
|
|
|
|
|
|
|
|
|
|
|
|
|
|
|
|
|
|
|
|
|
|
|
|
|
|
|
|
|
|
|
|
|
|
|
|
|
|
|
|
|
|
|
|
|
|
|
|
|
|
|
|
|
|
|
|
|
|
|
|
|
|
|
|
|
|
|
|
|
|
|
|
|
|
|
|
|
|
|
|
|
|
|
|
|
|
|
|
|
|
|
|
|
|
|
|
|
|
|
|
|
|
|
|
|
|
|
|
|
|
|
|
|
|
|
|
|
|
|
|
|
|
|
|
|
|
|
|
|
|
|
|
|
|
|
|
|
|
|
|
|
|
|
|
|
|
|
|
|
|
|
|
|
|
|
|
|
|
|
|
|
|
|
|
|
|
|
|
|
|
|
|
|
|
|
|
|
|
|
|
|
|
|
|
|
|
|
|
|
|
|
|
|
|
|
|
| General Fund
Expenditures - By Major Categories |
|
|
|
|
|
|
|
|
|
|
|
|
|
|
|
|
|
|
|
|
|
|
|
|
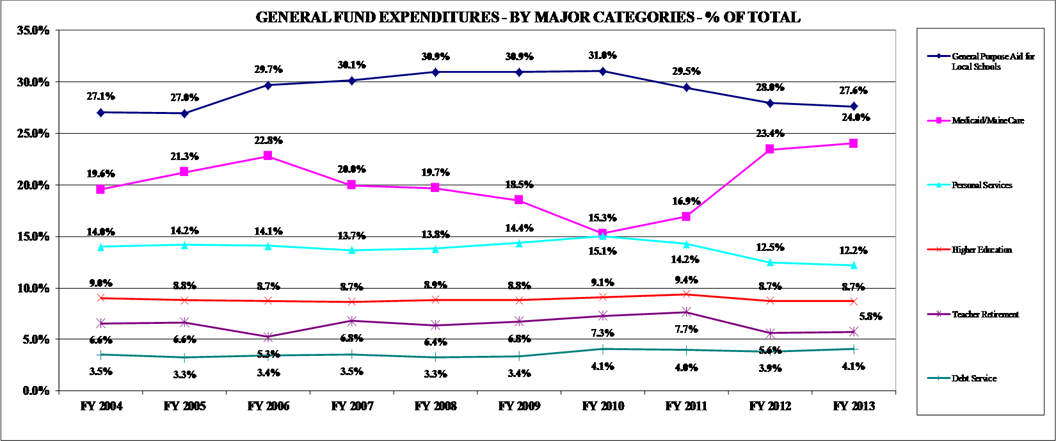
| Major Categories - % of
Total |
FY 2004 |
FY 2005 |
FY 2006 |
FY 2007 |
FY 2008 |
FY 2009 |
FY 2010 |
FY 2011 |
FY 2012 |
FY 2013 |
|
| General Purpose Aid for
Local Schools |
27.1% |
27.0% |
29.7% |
30.1% |
30.9% |
30.9% |
31.0% |
29.5% |
28.0% |
27.6% |
|
| Medicaid/MaineCare |
19.6% |
21.3% |
22.8% |
20.0% |
19.7% |
18.5% |
15.3% |
16.9% |
23.4% |
24.0% |
|
| Personal Services |
14.0% |
14.2% |
14.1% |
13.7% |
13.8% |
14.4% |
15.1% |
14.2% |
12.5% |
12.2% |
|
| Higher Education |
9.0% |
8.8% |
8.7% |
8.7% |
8.9% |
8.8% |
9.1% |
9.4% |
8.7% |
8.7% |
|
| Teacher Retirement |
6.6% |
6.6% |
5.3% |
6.8% |
6.4% |
6.8% |
7.3% |
7.7% |
5.6% |
5.8% |
|
| Debt Service |
3.5% |
3.3% |
3.4% |
3.5% |
3.3% |
3.4% |
4.1% |
4.0% |
3.9% |
4.1% |
|
| Other |
20.2% |
18.9% |
16.0% |
17.2% |
17.0% |
17.2% |
18.1% |
18.4% |
17.9% |
17.6% |
|
| Total General Fund
Expenditures |
100.0% |
100.0% |
100.0% |
100.0% |
100.0% |
100.0% |
100.0% |
100.0% |
100.0% |
100.0% |
|
| |
|
|
|
|
|
|
|
|
|
|
|
| |
|
|
|
|
|
|
|
|
|
|
|
| Detail of Personal Services: |
|
|
|
|
|
|
|
|
|
|
|
| Salaries and Wages |
9.8% |
9.3% |
9.1% |
8.9% |
8.8% |
9.2% |
9.7% |
9.3% |
8.4% |
8.2% |
|
| Retirement |
2.3% |
2.5% |
2.7% |
2.6% |
2.7% |
2.9% |
3.0% |
2.5% |
1.9% |
1.9% |
|
| Health Insurance |
1.5% |
2.0% |
1.9% |
1.8% |
1.8% |
1.8% |
1.9% |
2.0% |
1.8% |
1.8% |
|
| Other Fringe Benefits |
0.5% |
0.4% |
0.4% |
0.4% |
0.4% |
0.5% |
0.5% |
0.4% |
0.4% |
0.4% |
|
| Total |
14.0% |
14.2% |
14.1% |
13.7% |
13.8% |
14.4% |
15.1% |
14.2% |
12.5% |
12.2% |
|
|
|
|
|
|
|
|
|
|
|
|
|
|
|
|
|
|
|
|
|
|
|
|
|
|
|
|
|
|
|
|
|
|
|
|
Average Annual Growth |
| Annual % Change of Major
Categories |
FY 2004 |
FY 2005 |
FY 2006 |
FY 2007 |
FY 2008 |
FY 2009 |
FY 2010 |
FY 2011 |
FY 2012 |
FY 2013 |
| General Purpose Aid for
Local Schools |
1.7% |
5.6% |
13.5% |
8.7% |
4.8% |
-2.1% |
-4.8% |
-5.3% |
2.4% |
-2.7% |
|
| Medicaid/MaineCare |
3.6% |
15.1% |
10.6% |
-6.2% |
0.5% |
-8.0% |
-21.7% |
10.4% |
49.8% |
0.9% |
|
| Personal Services |
-0.2% |
7.1% |
2.8% |
3.7% |
3.0% |
2.0% |
-0.5% |
-5.6% |
-5.2% |
-3.6% |
|
| Higher Education |
-0.8% |
3.3% |
2.3% |
6.2% |
4.2% |
-2.5% |
-1.6% |
2.5% |
0.5% |
-2.0% |
|
| Teacher Retirement |
-5.5% |
6.9% |
-18.3% |
38.4% |
-4.2% |
3.6% |
2.5% |
4.8% |
-21.2% |
1.4% |
|
| Debt Service |
-3.9% |
-2.1% |
7.7% |
11.5% |
-4.9% |
-0.1% |
14.5% |
-2.9% |
5.2% |
3.9% |
|
| Other |
7.8% |
-0.9% |
-12.6% |
15.2% |
0.6% |
-0.7% |
-0.2% |
1.0% |
5.3% |
-3.1% |
|
| Total General Fund
Expenditures |
2.0% |
6.0% |
3.2% |
7.1% |
2.0% |
-2.1% |
-5.1% |
-0.3% |
8.0% |
-1.5% |
|
| |
|
|
|
|
|
|
|
|
|
|
|
| Detail of Personal Services: |
|
|
|
|
|
|
|
|
|
|
|
| Salaries and Wages |
2.5% |
0.7% |
0.8% |
4.7% |
1.8% |
1.8% |
-0.3% |
-3.7% |
-2.9% |
-3.8% |
|
| Retirement |
1.6% |
14.2% |
10.9% |
3.9% |
6.7% |
4.0% |
-1.8% |
-16.4% |
-16.2% |
-4.0% |
|
| Health Insurance |
-16.9% |
41.7% |
1.1% |
-1.3% |
3.2% |
0.5% |
0.1% |
2.8% |
-3.4% |
-3.5% |
|
| Other Fringe Benefits |
-1.7% |
-3.5% |
4.9% |
2.0% |
6.0% |
-0.2% |
-0.4% |
-11.1% |
-0.3% |
0.1% |
|
| Total |
-0.2% |
7.1% |
2.8% |
3.7% |
3.0% |
2.0% |
-0.5% |
-5.6% |
-5.2% |
-3.6% |
|
|
|
|
|
|
|
|
|
|
|
|
|
|
|
|
|
|
|
|
|
|
|
|
|
|
|
|
|
|
|
|
|
|
|
|
|
|
|
|
|
|
|
|
|
|
|
|
|
|
|
|
|
|
|
|
|
|
|
|
|
|
|
|
|
|
|
|
|
|
|
|
|
|
|
|
|
|
|
|
|
|
|
|
|
|
|
|
|
|
|
|
|
|
|
|
|
|
|
|
|
|
|
|
|
|
|
|
|
|
|
|
|
|
|
|
|
|
|
|
|
|
|
|
|
|
|
|
|
|
|
|
|
|
|
|
|
|
|
|
|
|
|
|
|
|
|
|
|
|
|
|
|
|
|
|
|
|
|
|
|
|
|
|
|
|
|
|
|
|
|
|
|
|
|
|
|
|
|
|
|
|
|
|
|
|
|
|
|
|
|
|
|
|
|
|
|
|
|
|
|
|
|
|
|
|
|
|
|
|
|
|
|
|
|
|
|
|
|
|
|
|
|
|
|
|
|
|
|
|
|
|
|
|
|
|
|
|
|
|
|
|
|
|
|
|
|
|
|
|
|
|
|
|
|
|
|
|
|
|
|
|
|
|
|
|
|
|
|
|
|
|
|
|
|
|
|
|
|
|
|
|
|
|
|
|
|
|
|
|
|
|
|
|
|
|
|
|
|
|
|
|
|
|
|
|
|
|
|
|
|
|
|
|
|
|
|
|
|
|
|
|
|
|
|
|
|
|
|
|
|
|
|
|
|
|
|
|
|
|
|
|
|
|
|
|
|
|
|
|
|
|
|
|
|
|
|
|
|
|
|
|
|
|
|
|
|
|
|
|
|
|
|
|
|
|
|
|
|
|
|
|
|
|
|
|
|
|
|
|
|
|
|
|
|
|
|
|
|
|
|
|
|
|
|
|
|
|
|
|
|
|
|
|
|
|
|
|
|
|
|
|
|
|
|
|
|
|
|
|
|
|
|
|
|
|
|
|
|
|
|
|
|
|
|
|
|
|
|
|
|
|
|
|
|
|
|
|
|
|
|
|
|
|
|
|
|
|
|
|
|
|
|
|
|
|
|
|
|
|
|
|
|
|
|
|
|
|
|
|
|
|
|
|
|
|
|
|
|
|
|
|
|
|
|
|
|
|
|
|
|
|
|
|
|
|
|
|
|
|
|
|
|
|
|
|
|
|
|
|
|
|
|
|
|
|
|
|
|
|
|
|
|
|
|
|
|
|
|
|
|
|
|
|
|
|
|
|
|
|
|
|
|
|
|
|
|
|
|
|
|
|
|
|
|
|
|
|
|
|
|
|
|
|
|
|
|
|
|
|
|
|
|
|
|
|
|
|
|
|
|
|
|
|
|
|
|
|
|
|
|
|
|
|
|
|
|
|
|
|
|
|
|
|
|
|
|
|
|
|
|
|
|
|
|
|
|
|
|
|
|
|
|
|
|
|
|
|
|
|
|
|
|
|
|
|
|
|
|
|
|
|
|
|
|
|
|
|
|
|
|
|
|
|
|
|
|
|
|
|
|
|
|
|
|
|
|
|
|
|
|
|
|
|
|
|
|
|
|
|
|
|
|
|
|
|
|
|
|
|
|
|
|
|
|
|
|
|
|
|
|
|
|
|
|
|
|
|
|
|
|
|
|
|
|
|
|
|
|
|
|
|
|
|
|
|
|
|
|
|
|
|
|
|
|
|
|
|
|
|
|
|
|
|
|
|
|
|
|
|
|
|
|
|
|
|
|
|
|
|
|
|
|
|
|
|
|
|
|
|
|
|
|
|
|
|
|
|
|
|
|
|
|
|
|
|
|
|
|
|
|
|
|
|
|
|
|
|
|
|
|
|
|
|
|
|
|
|
|
|
|
|
|
|
|
|
|
|
|
|
|
|
|
|
|
|
|
|
|
|
|
|
|
|
|
|
|
|
|
|
|
|
|
|
|
|
|
|
|
|
|
|
|
|
|
|
|
|
|
|
|
|
|
|
|
|
|
|
|
|
|
|
|
|
|
|
|
|
|
|
|
|
|
|
|
|
|
|
|
|
|
|
|
|
|
|
|
|
|
|
|
|
|
|
|
|
|
|
|
|
|
|
|
|
|
|
|
|
|
|
|
|
|
|
|
|
|
|
|
|
|
|
|
|
|
|
|
|
|
|
|
|
|
|
|
|
|
|
|
|
|
|
|
|
|
|
|
|
|
|
|
|
|
|
|
|
|
|
|
|
|
|
|
|
|
|
|
|
|
|
|
|
|
|
|
|
|
|
|
|
|
|
|
|
|
|
|
|
|
|
|
|
|
|
|
|
|
|
|
|
|
|
|
|
|
|
|
|
|
|
|
|
|
|
|
|
|
|
|
|
|
|
|
|
|
|
|
|
|
|
|
|
|
|
|
|
|
|
|
|
|
|
|
|
|
|
|
|
|
|
|
|
|
|
|
|
|
|
|
|
|
|
|
|
|
|
|
|
|
|
|
|
|
|
|