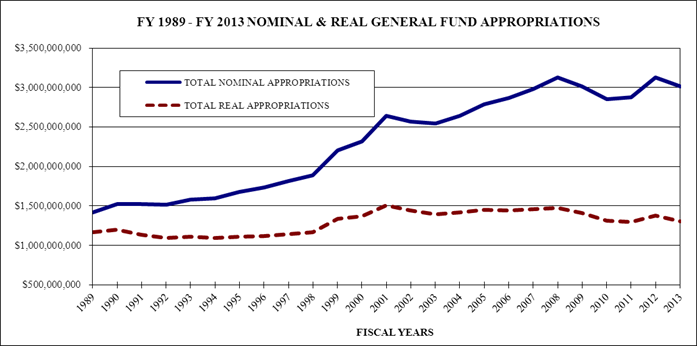
| GENERAL FUND APPROPRIATIONS:
FY 1989 - FY 2013 |
|
|
|
|
|
|
|
|
|
|
|
|
|
|
|
|
ACTUAL VALUES |
|
CPI |
|
DEFLATED VALUES |
|
|
|
|
|
|
|
|
|
|
|
|
|
|
FISCAL YEAR |
|
TOTAL NOMINAL APPROPRIATIONS |
% |
|
YEARLY |
% |
|
TOTAL REAL |
% |
|
|
|
CHG. |
|
AVG. |
CHG. |
|
APPROPRIATIONS |
CHG. |
|
|
1986 |
|
$961,825,581 |
|
|
108.82 |
|
|
$883,895,464 |
|
|
|
1987 |
|
$1,070,583,411 |
11.3% |
|
111.23 |
2.2% |
|
$962,466,357 |
8.9% |
|
|
1988 |
|
$1,184,719,563 |
10.7% |
|
115.84 |
4.1% |
|
$1,022,705,903 |
6.3% |
|
|
1989 |
|
$1,415,950,225 |
19.5% |
|
121.19 |
4.6% |
|
$1,168,356,096 |
14.2% |
|
|
1990 |
|
$1,520,692,150 |
7.4% |
|
126.98 |
4.8% |
|
$1,197,631,148 |
2.5% |
|
|
1991 |
|
$1,520,285,074 |
0.0% |
|
133.92 |
5.5% |
|
$1,135,247,099 |
-5.2% |
|
|
1992 |
|
$1,516,169,287 |
-0.3% |
|
138.21 |
3.2% |
|
$1,097,017,271 |
-3.4% |
|
|
1993 |
|
$1,577,593,982 |
4.1% |
|
142.53 |
3.1% |
|
$1,106,889,305 |
0.9% |
|
|
1994 |
|
$1,599,447,945 |
1.4% |
|
146.22 |
2.6% |
|
$1,093,888,940 |
-1.2% |
|
|
1995 |
|
$1,673,401,754 |
4.6% |
|
150.41 |
2.9% |
|
$1,112,572,500 |
1.7% |
|
|
1996 |
|
$1,733,842,806 |
3.6% |
|
154.50 |
2.7% |
|
$1,122,228,353 |
0.9% |
|
|
1997 |
|
$1,815,498,708 |
4.7% |
|
158.91 |
2.9% |
|
$1,142,481,750 |
1.8% |
|
|
1998 |
|
$1,888,812,553 |
4.0% |
|
161.74 |
1.8% |
|
$1,167,795,901 |
2.2% |
|
|
1999 |
|
$2,201,734,442 |
16.6% |
|
164.54 |
1.7% |
|
$1,338,101,459 |
14.6% |
|
|
2000 |
|
$2,316,629,198 |
5.2% |
|
169.29 |
2.9% |
|
$1,368,424,828 |
2.3% |
|
|
2001 |
|
$2,645,121,992 |
14.2% |
|
175.09 |
3.4% |
|
$1,510,706,958 |
10.4% |
|
|
2002 |
|
$2,565,345,849 |
-3.0% |
|
178.19 |
1.8% |
|
$1,439,655,342 |
-4.7% |
|
|
2003 |
|
$2,540,382,576 |
-1.0% |
|
182.11 |
2.2% |
|
$1,394,984,254 |
-3.1% |
|
|
2004 |
|
$2,642,999,485 |
4.0% |
|
186.09 |
2.2% |
|
$1,420,267,512 |
1.8% |
|
|
2005 |
|
$2,784,473,472 |
5.4% |
|
191.69 |
3.0% |
|
$1,452,579,301 |
2.3% |
|
|
2006 |
|
$2,871,878,613 |
3.1% |
|
198.99 |
3.8% |
|
$1,443,215,518 |
-0.6% |
|
|
2007 |
|
$2,978,358,710 |
3.7% |
|
204.14 |
2.6% |
|
$1,458,966,589 |
1.1% |
|
|
2008 |
|
$3,129,325,355 |
5.1% |
|
211.70 |
3.7% |
|
$1,478,205,516 |
1.3% |
|
|
2009 |
|
$3,017,952,419 |
-3.6% |
|
214.66 |
1.4% |
|
$1,405,936,855 |
-4.9% |
|
|
2010 |
|
$2,849,227,923 |
-5.6% |
|
216.74 |
1.0% |
|
$1,314,613,158 |
-6.5% |
|
|
2011 |
|
$2,872,754,172 |
0.8% |
|
221.09 |
2.0% |
|
$1,299,376,267 |
-1.2% |
|
|
2012 |
|
$3,130,209,894 |
9.0% |
|
227.56 |
2.9% |
|
$1,375,524,941 |
5.9% |
|
|
2013 |
* |
$3,012,524,581 |
-3.8% |
|
231.21 |
1.6% |
|
$1,302,962,453 |
-5.3% |
|
|
|
|
|
|
|
|
|
|
|
|
|
| * |
Amounts represent appropriations through 125th
Legislature, 2nd Regular Session and FY 12 closing transfers |
|
CPI for FY 2013 reflect projections of the
Consensus Economic Forecasting Commission (February 2012) |
|
|
|
|
|
|
|
|
|
|
|
|
|
|
SOURCES: |
OFPR General Fund Appropriations Summaries |
|
|
|
|
|
|
|
U.S. Dept. of Labor, Bureau of Labor
Statistics, Consumer Price Index for All Urban Consumers |
|
|
|
(Calendar Years 1982-84 Average = 100) |
|
|
|
|
|
|
|
|
|
|
|
|
|
|
|
|
|
|
|
|
|
|
|
|
|
|
|
|
|
|
|
|
|
|
|
|
|
|
|
|
|
|
|
|
|
|
|
|
|
|
|
|
|
|
|
|
|
|
|
|
|
|
|
|
|
|
|
|
|
|
|
|
|
|
|
|
|
|
|
|
|
|
|
|
|
|
|
|
|
|
|
|
|
|
|
|
|
|
|
|
|
|
|
|
|
|
|
|
|
|
|
|
|
|
|
|
|
|
|
|
|
|
|
|
|
|
|
|
|
|
|
|
|
|
|
|
|
|
|
|
|
|
|
|
|
|
|
|
|
|
|
|
|
|
|
|
|
|
|
|
|
|
|
|
|
|
|
|
|
|
|
|
|
|
|
|
|
|
|
|
|
|
|
|
|
|
|
|
|
|
|
|
|
|
|
|
|
|
|
|
|
|
|
|
|
|
|
|
|
|
|
|
|
|
|
|
|
|
|
|
|
|
|
|
|
|
|
|
|
|
|
|
|
|
|
|
|
|
|
|
|
|
|
|
|
|
|
|
|
|
|
|
|
|
|
|
|
|
|
|
|
|
|
|
|
|
|
|
|