Home → Spills & Site Cleanup → Programs > Petroleum Clean Up > Evaluation of PID and FID Field Instrument Responses
Evaluation of PID and FID Field Instrument Responses
To Weathered Petroleum Products
June, 2004
- Introduction
- Instruments Evaluated in the Study
- Test Gas Design
- Test Gas Blending/Conditioning
- Procedure
- Results and discussion
- Conclusions
Introduction
In June 2004 the Maine Department of Environmental Protection (MDEP) bench-tested several photoionization (PID) and flame ionization (FID) -based field instruments used by staff and consutants in petroleum investigations. The work was undertaken to update a similar MDEP study made in 1996 of the models of PIDs and FIDs in common use at that time.(1)
Both studies evaluated the subject instruments' response to test gases designed to represent the headspace over soils contaminated with weathered motor vehicle fuels and heating products. Based on results of the early study, MDEP developed factors ("set points") by which each instrument's response must be adjusted to report a sample's true hydrocarbon concentration. Use of these set points has been mandatory since 1997 in determining whether the Maine notification level(2) has been exceeded during UST site assessments, and for determining whether cleanup of Baseline-2 (BL-2) sites(3) is complete. The 2004 work was undertaken to establish set points for models of PID and FID not available previously. It also served as a check on the previous work, using blending and measurement techniques which improved on the 1996 procedure.
Instruments Evaluated in the Study
All known manufacturers of PID and FID field instruments were invited to submit copies of their products for evaluation. In addition MDEP re-evaluated several Department-owned instruments no longer on the market but still in frequent use by consultants. Only PID-based instruments with lamp energies between 10.0 and 11.0 eV were included in the study.
MDEP required that all furnished units be new or, if used, maintained and serviced according to manufacturers' recommendations, be cleaned and tested by the manufacturer before shipping, and be sent with all necessary calibration and minor servicing supplies.
The instruments evaluated in the study are shown in Table 1.
Table 1 Instruments in MDEP 2004 Evaluation |
|
Manufacturer |
Model |
Hnu Systems, Inc. |
HW-101 |
Hnu Systems, Inc. |
DL-102 |
MSA, Inc. |
Passport PID II OVM |
Thermo Environmental |
OVM 580B |
Thermo Environmental |
TVA-1000B |
RAE Systems, Inc |
MiniRAE 2000 |
All instruments were inspected upon receipt, their batteries charged, operating manuals reviewed, and their satisfactory operation was confirmed.
Test Gas Design
Test gases were formulated and conditioned to simulate headspaces over soils contaminated with weathered petroleum products. Compositions were determined by analyzing headspaces over samples of neat weathered product from several petroleum remediation sites. Hydrocarbon compounds identified in the analyses were grouped by their principal chemical classes and a single compound was chosen to represent each class. Surrogate stock gases representing weathered gasoline and weathered #2 fuel oil, each at approximately 2000 ppmv total petroleum hydrocarbons, were then ordered from a specialty gas supplier. The composition of the stock gases is shown in Table 2.
Table 2 Composition of Stock Gases |
|||
Chemical Class |
Representative Compound |
Gasoline Stock Gas |
#2 Fuel Oil Stock Gas |
|
Alkanes |
2-methyl butane |
1000 ppm |
1000 ppm |
|
Alkenes |
2-methyl propene |
400 ppm |
|
Cycloalkanes |
Cyclopropane |
|
600 ppm |
|
Cycloalkanes |
Cyclopentene |
200 ppm |
200 ppm |
|
Aromatics |
Toluene |
400 ppm |
400 ppm |
Nitrogen made up the remaining 99.8% of the stock gas volume. Nitrogen was chosen as the balance gas to minimize degradation of the hydrocarbon components during storage in pressurized cylinders. However, when more than about 1/3 of stock gas was needed to obtain the desired hydrocarbon concentrations in the test gas, the oxygen content of the resulting mixture was less than 15%, not enough to sustain operation of FID instruments. PID-based instruments were not affected.
Test Gas Blending/Conditioning
The equipment train used to blend and condition the test gases is shown in Figure 1. Zero air and 2000 ppm stock gas were metered through separate rotameters (Omega FL-1400 series) in proportions required to produce the desired test gas concentrations at flow rates recommended for each test instruments In order to simulate headspaces found over jarred soil samples, the zero-air component of the blend was humidified in a wash bottle (Kimble-Kontes, 350 ml) to nearly 100% RH. The blended test gas could not be humidifed, as the more water-soluble hydrocarbons would have been stripped, changing the component proportions. The blended, humidified test gases were passed through a cell for measuring temperature and humidity (Testo Model 625), then sent on to the test instrument. The flow rate of test gas was maintained slightly in excess of instrument requirements. A sidestream was continuously bled to atmosphere through a water trap, which maintained pressure at about 1/2" H2O. Pressure was monitored continuously by a Magnehelic gauge, whose full-scale reading was 1" H2O. Gas residence time in the equipment train was less than one minute at the lowest flow rates used.
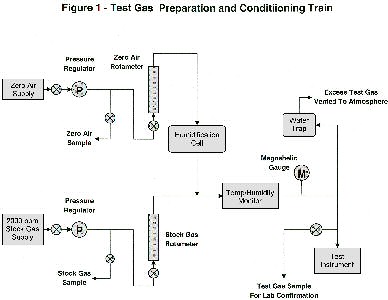 Figure 1-Click here for a full screen version or print-quality version of the graphic at left
Procedure
The testing was conducted in two sessions, with all instruments tested against gasoline headspaces during the first session and against fuel oil headspaces during the second. At the beginning of each session all instruments were warmed up, battery conditions checked, and calibrated per manufacturers' procedures.
Each session was begun by setting the rotameters to deliver a 100 ppmv test gas. When flow rates and concentration had stabilized throughout the equipment train (as indicated by stable humidity and temperature), a tedlar bag sample was taken for laboratory confirmation analysis. Instruments were then connected one at a time to the sampling point, allowed to stabilize, and their reading taken. Rotameter, temperature, humidity, and pressure readings were monitored throughout testing. When all instruments had been tested, a second bagged sample was taken, to ensure test gas concentration had not changed significantly.
Rotameter settings were then adjusted to deliver a 200 ppmv test gas and the above steps of instrument testing and confirmation sampling were repeated. The procedure was repeated twice more, for test gas target concentrations of 500 and 1000 ppmv.
At the end of the session each instrument was re-checked against its span gases, to determine whether its calibration had drifted. No significant drift was observed in any instrument during either session. Each testing session took approximately four hours.
Results and Discussion
Results from confirmation testing of the gases is shown in Tables 3 and 4 (below). Leaks in the tedlar bags made several of the samples unsuitable for analysis. However, either a "before" or "after" samples was available for both headspace surrogates at all concentrations. Where both "before" and "after" analyses were available, the Total Petroleum Hydrocarbon (TPH) concentration was reported as the average of the two.
Table 3 - Gasoline Test Gas Confirmation Samples |
||||||||||||
100 ppm Test Gas |
200 ppm Test Gas |
500 ppm Test Gas |
1000 ppm Test Gas |
|||||||||
Target |
Initial |
Final |
Target |
Initial |
Final |
Target |
Initial |
Final |
Target |
Initial |
Final |
|
Total Hydrocarbons |
100 |
Bag |
112 |
200 |
169 |
168 |
500 |
436 |
472 |
1000 |
1007 |
Bag |
2-Methyl butane |
50 |
45 |
100 |
78 |
71 |
250 |
223 |
231 |
500 |
502 |
||
2-Methyl Propene |
20 |
22 |
40 |
37 |
35 |
100 |
96 |
98 |
200 |
211 |
||
Cyclopentene |
10 |
11 |
20 |
18 |
18 |
50 |
50 |
53 |
100 |
114 |
||
Toluene |
20 |
15 |
40 |
7.6 |
29 |
100 |
83 |
134 |
200 |
344 |
||
Table 4 - #2 Fuel Oil Test Gas Confirmation Samples |
||||||||||||
100 ppm Test Gas |
200 ppm Test Gas |
500 ppm Test Gas |
1000 ppm Test Gas |
|||||||||
Target |
Initial |
Final |
Target |
Initial |
Final |
Target |
Initial |
Final |
Target |
Initial |
Final |
|
Total Hydrocarbons |
110 |
100 |
100 |
220 |
182 |
176 |
550 |
457 |
Bag |
1100 |
791 |
1016 |
2-Methyl butane |
30 |
30 |
30 |
60 |
59 |
60 |
150 |
153 |
300 |
242 |
344 |
|
2-Methyl Propene |
50 |
52 |
52 |
100 |
100 |
101 |
250 |
255 |
500 |
438 |
542 |
|
Cyclopentene |
10 |
8.7 |
10 |
20 |
20 |
20 |
50 |
53 |
100 |
89 |
113 |
|
Toluene |
20 |
5.5 |
4.5 |
40 |
16 |
8.1 |
100 |
71 |
200 |
191 |
269 |
|
Lab analysis showed that actual TPH concentrations were consistently within 20% of target values and remained reasonably stable during instrument testing. Component analyses also matched target values well except for toluene, which ranged from as little as 20% to over 150% of targets. The lab performing the testing reported that toluene analysis at these concentrations often gives anomolous results. However, it was not possible to determine whether the discrepancy was real or an artifact of sampling or analysis.
Results of instrument testing are shown in Tables 5 and 6 (below) and graphically in Figures 2 and 3 (clicking here opens new browser window). Instrument response was generally comparable with that observed in the 1994 study. All instruments showed acceptably linear response over the range of concentrations tested. Correlation coefficients for all instruments were 0.97 or higher against gasoline test gases and 0.96 or higher against #2 fuel oil.
Table 5 - Results Using Gasoline Test Gas |
|||||||||||
Target |
Meaasured |
Temp |
RH |
|
Instrument Reading (as ppmv isobutylene)* |
||||||
MiniRAE |
HNu |
HNu |
TEI |
MSA |
TVA- |
TVA- |
|||||
100 |
112 |
24 |
93 |
41 |
14 |
22 |
68 |
39 |
41 |
114 |
|
200 |
168 |
23 |
89 |
64 |
29 |
32 |
99 |
67 |
51 |
189 |
|
500 |
454 |
23 |
78 |
189 |
99 |
130 |
168 |
171 |
130 |
483 |
|
1000 |
1007 |
23 |
50 |
519 |
340 |
518 |
405 |
405 |
356 |
-- |
|
Table 6 - Results Using #2 Fuel Oil Test Gas |
|||||||||||
Target |
Meaasured |
Temp |
RH |
|
Instrument Reading (as ppmv isobutylene)* |
||||||
MiniRAE |
HNu |
HNu |
TEI |
MSA |
TVA- |
TVA- |
|||||
100 |
100 |
24 |
93 |
58 |
14 |
13.2 |
37 |
22.4 |
14.3 |
150 |
|
200 |
179 |
24 |
89 |
71 |
23 |
24.1 |
67 |
44 |
27 |
271 |
|
500 |
457 |
24 |
75 |
182 |
89 |
111 |
180 |
161 |
97 |
675 |
|
1000 |
904 |
24 |
51 |
469 |
240 |
344 |
260 |
342 |
329 |
-- |
|
* Readings of TVA-1000B (FID) as ppmv methane
Figures 2 & 3 (opens new browser window)
Instrument response slopes among the PIDs varied from 0.31 to 0.49 for the gasoline surrogate and from 0.25 to 0.49 for the #2 fuel oil surrogate. The response of the most sensitive PID exceeded that of the least sensitive by factors of 1.6 and 2.0 for gasoline and fuel oil, respectively.The single FID demonstrated a slope factor greater than 1.0 to both surrogates, meaning it "overreports," relative to its methane span gas. However, this instrument's published response factor for isobutylene is 0.64, meaning that measurements would be lower by that amount, if referenced to the same span gas as the PIDs.
In addition, FID response is affected very little by the high relative humidities of the test gases. By comparison, the MiniRAE 2000 manual reports that instrument's response is reduced approximately 20% by a water vapor concentration of 15,000 ppm and by 40% at 30,000 ppm. These concentrations correspond to RHs of, respectively, 50% and 100% at the test gas temperatures, suggesting that their water content was high enough to significantly depress PID response. The effect could have been quantified by eliminating the wash bottle from the blending/conditioning train, but this was not done.
As expected, the FID's response to the 1000 ppm hydrocarbon concentration could not be determined, because test gas oxygen content (approximately 10%) was too low to support combustion.
Conclusions
Results from this study were considered a sufficient basis to adjust MDEP set points for previously evaluated instruments, and to establish set points for the two new instruments.
Instruments should be calibrated (or their readings corrected) in accordance with these set points only when measuring weathered motor vehicle fuel vapors (e.g., gasoline, diesel, or JP-5), light heating products (e.g. kerosene or #2 fuel oil), or similar midrange petroleum distillates at relative humidities approaching 100%. This adjustment would be appropriate for the headspace over jarred soil samples, along the walls and floor of excavations, or in a sheltered "pocket" scooped into stockpiled soil. The factors derived in this study have not been validated for non-petroleum compounds (e.g., chlorinated solvents), heavy oils, waste oil, or products with high oxygenate content. They should not be relied upon when the headspace is known to contain non-petroleum compounds that could contribute to the instrument's response.
1 "Development of Calibration Set Points For Selected Flame- and Photoionization Detectors For Use at Petroleum Release Sites: 1995 Experiments," Wallace et.al., 1996.
2 06-096 CMR Chapter 691, "Rules For Underground Oil Storage Facilities, Appendix P: Requirements for a Site Assessment at Facility Closure or Tank Abandonment, " Maine Department of Environmental Protection, 2004.
3 "Procedural Guidelines for Establishing Action Levels and Remediation Goals for the Remediation of Oil Contaminated Soil and Groundwater in Maine," Maine Department of Environmental Protection, 2000.
Top